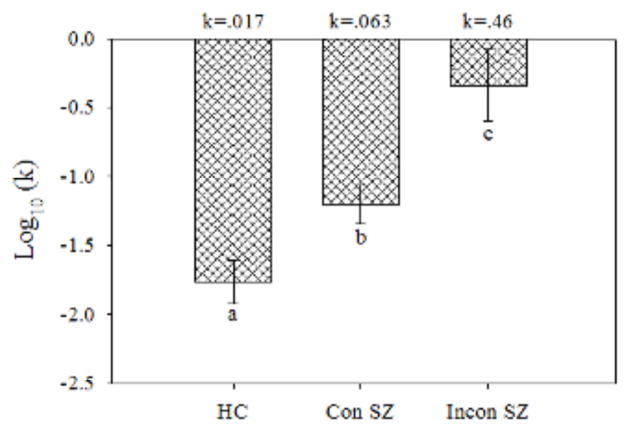
Fig. 3.
Mean (± standard error) log(k) for the healthy controls (HC), consistent patients with schizophrenia (Con SZ), and inconsistent patients with schizophrenia (Incon SZ). Smaller negative values indicate greater delay discounting. The values at top above each group are the k values corresponding to the log(k) values on the y-axis and in Table 1. Letters (a, b, c) indicate that all group differences were significant (p < 0.05).

