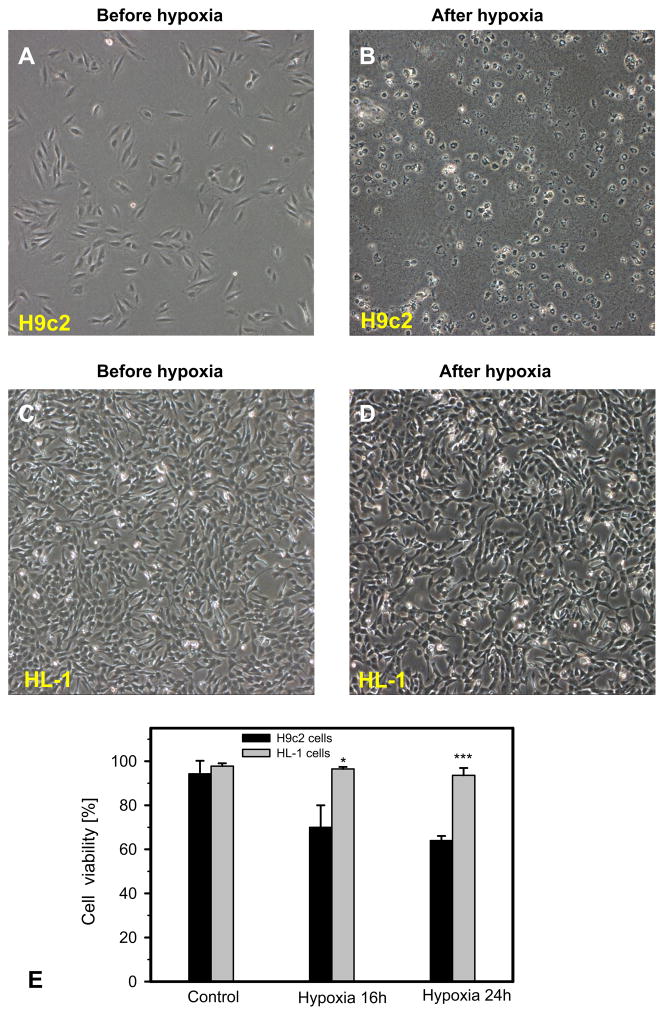
Fig. 5.
Increased sensitivity of H9c2 cells to hypoxia compared to HL-1 cells. A–D: Representative phase contrast microscopy of H9c2 and HL-1 cells. Representative phase contrast pictures were taken before (A, C) and after (B, D) hypoxic treatment (0. 4% oxygen) for 16 h and reoxygenation for 24 h. H9c2 cells were almost completely lysed after hypoxia, whereas HL-1 substantially survived after the same hypoxic regime. HL-1 and H9c2 cells were seeded in 6-well plates and grown overnight under their corresponding conditions. E: Quantitative data of cell viability after 16 h and 24 h of hypoxia. N = 3; * P < 0.05; *** P < 0.001.

