
Figure 5.
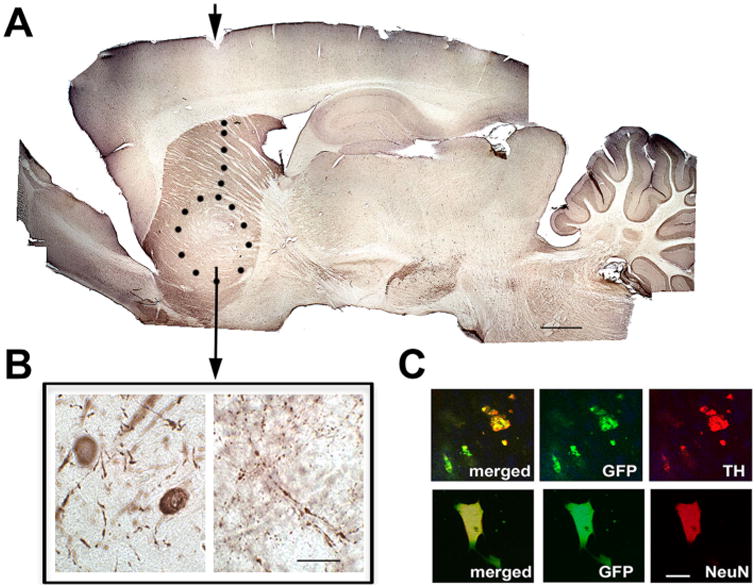
Histology of rat brain 6 months after striatal transplantation of the stable MEF2CA-hESC-derived neural progenitors. These data are representative of six rats that were transplanted, monitored behaviorally, and then sacrificed and perfused for histological analysis. A: Representative image of a whole-mount section of rat brain immunostained with the dopaminergic neuronal marker TH showing the extent of the implant in the striatum (indicated by dotted line with arrowhead showing injection site). B: Higher magnification image from the grafted region, revealing TH+ neuronal cell bodies and neuronal fibers. C: Representative immunofluorescence images reflecting the fact that GFP+ cells (indicating transplanted cells) were also positive for NeuN and TH (neuronal and DA markers, respectively). Over 90% of the GFP+ cells were also TH+. For abbreviations, see list. Scale bar = 250 μm in A; 25 μm in B; 10 μm in C.