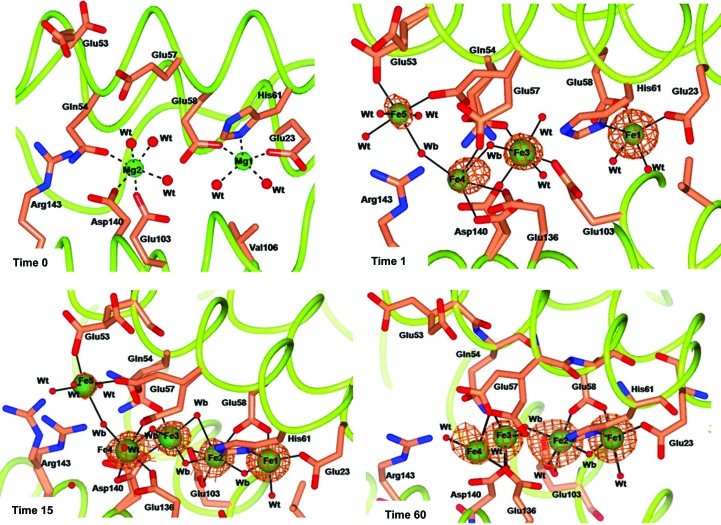
Figure 3.
Effect of different exposure times to Mohr’s salt on metal ion binding to the RcMf H54Q variant. The four panels show the Mg-bound RcMf H54Q variant (time 0) and the Fe binding sites populated after 1, 15 and 60 min of iron treatment. Mg2+ ions are represented by light green spheres, Fe2+ ions are represented by dark green spheres of arbitrary radius with the superimposed anomalous difference map contoured at 5.0σ shown as copper wire. The Fourier maps corresponding to other atoms have been omitted for clarity. The amino acids involved in iron binding are shown as sticks. Water molecules are shown as small red spheres. The additional Fe5 site is shown in the time 1 and time 15 panels.

