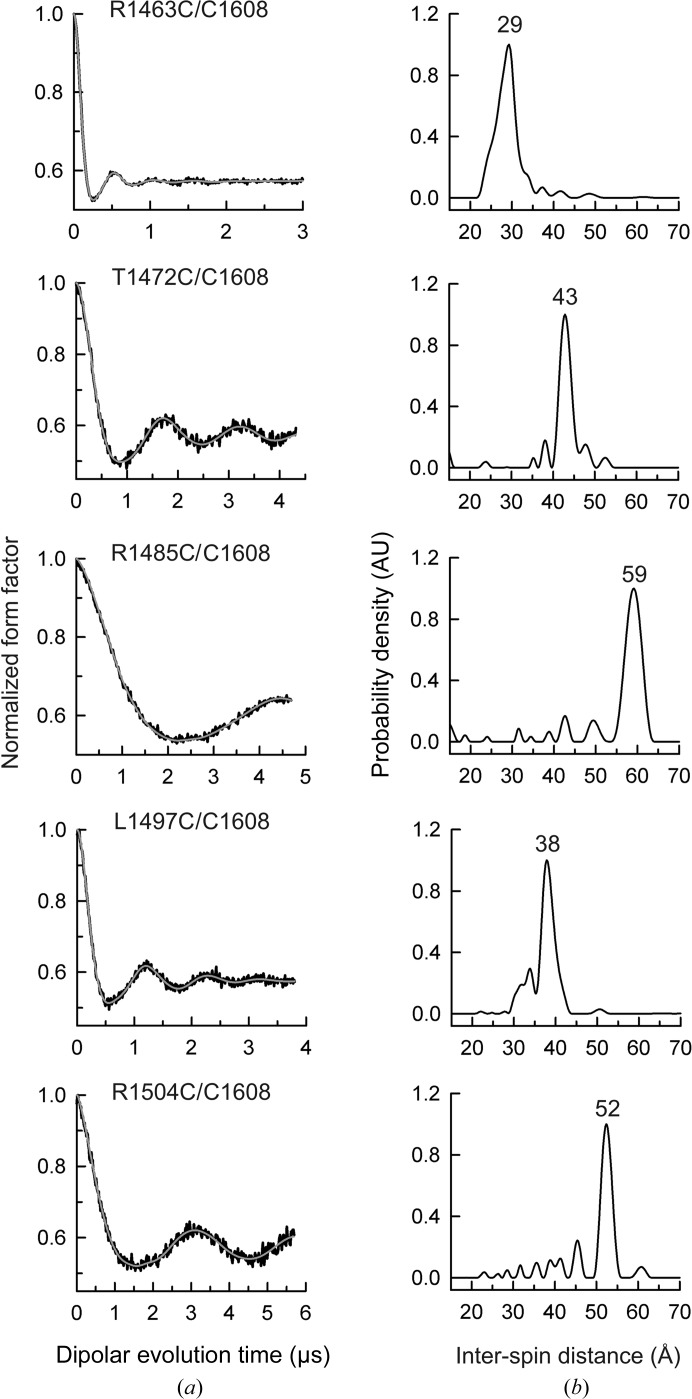
Figure 5.
DEER results for the doubly labelled FnIII-3,4 mutants used to gather distances between C1608 in FnIII-4 and five positions in FnIII-3. (a) Normalized dipolar evolution (black lines) and fits to the data (grey lines) for each double Cys mutant. (b) Inter-spin distance distribution profiles calculated from the data in (a). The distances of the major peaks are indicated at the top.

