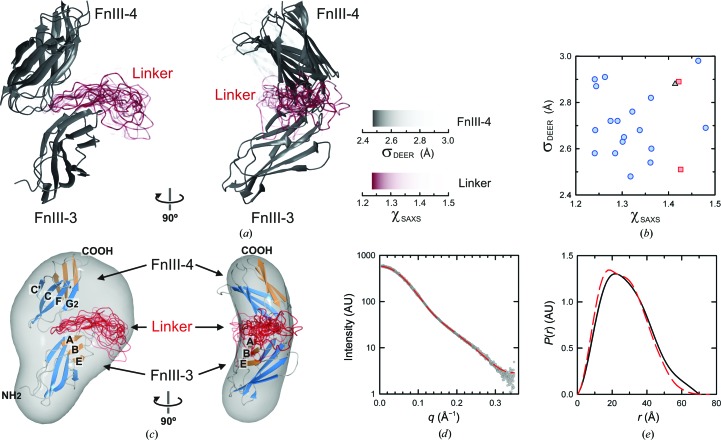
Figure 8.
Structure of the FnIII-3,4 region derived from a combination of crystal structures, DEER, SAXS and modelling methods. (a) Two views of the ensemble of models of FnIII-3,4 that fit the DEER and SAXS data. The orientations of FnIII-4 are coloured according to the fit to the 15 DEER restraints (σDEER) of the best models once the linker had been built. The colour intensity of the models of the linker (red) denotes the fit to the SAXS data (χSAXS) of the FnIII-3,4 structures. The σDEER and χSAXS colour scales are shown. (b) Plot of the σDEER and χSAXS values determined for the 21 models that best fit to the experimental data. χSAXS was determined for q ≤ 0.3 Å−1. Points with the same symbol correspond to models with the same orientation of FnIII-4. The SAXS profile is sensitive to the conformation of the linker, as revealed by the wide spread of χSAXS values for a given arrangement of the two FnIII domains. (c) Docking of the atomic models to the SAXS-derived averaged molecular envelope. For clarity, only the most frequent FnIII-4 orientation and the corresponding modelled linkers are shown. (d) Comparison of the theoretical scattering curve of the model with lowest χSAXS (red dashed line) to the experimental SAXS data (grey dots). (e) P(r) functions calculated for the atomic model (red dashed line) and estimated from the SAXS data (black line). Details of the modelling of the inter-domain orientation are shown in Supplementary Fig. S11.

