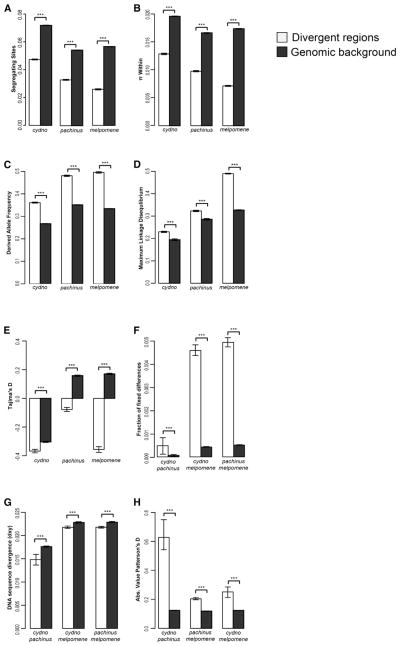
Figure 6. Divergent Regions of the Genome Exhibit Signatures of Selection and Adaptive Introgression.
Each panel shows the mean values of population genetic statistics inside divergent regions (white bars) versus the genomic background (gray bars).
Segregating site density (A), π within species (B), derived allele frequency (C), maximum linkage disequilibrium (D), Tajima’s D (E), fraction of fixed differences between species (F), mean pairwise sequence divergence between species (dXY) (G), and absolute value of Patterson’s D statistic for the four taxon ordering: H. cydno, H. pachinus, H. melpomene, outgroup (H. hecale and H. ismenius) (H). Error bars (indicating 95% confidence intervals) and p values are based on bootstrap resampling. ***p < 0.0001.

