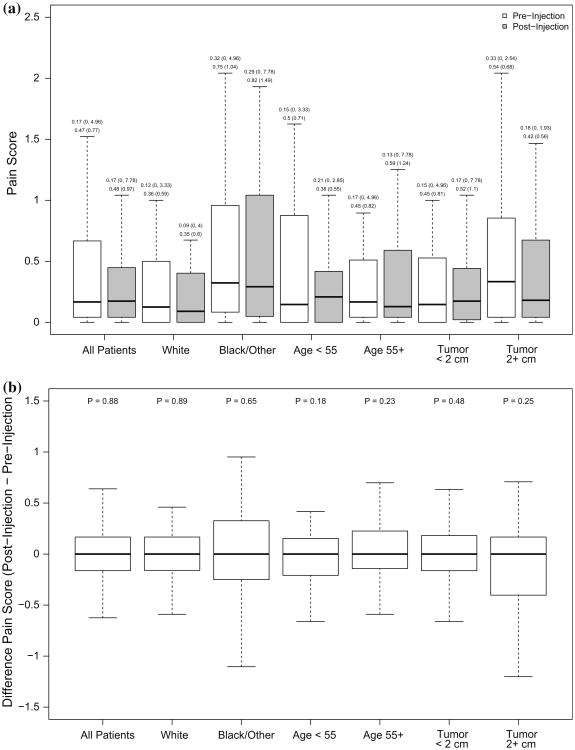
Fig. 2.
Distribution of pain scores. Boxplots showing, a the distribution of pain scores at the pre-injection and post-injection time point for all patients and separately by categories of age, race, and tumor size. Summary statistics [median (min, max) and mean (SD)] are shown above each box; b the distribution of the difference in pain scores (post-injection–pre-injection) for all patients and separately by categories of age, race, and tumor size. P values above each subgroup are for paired t tests for differences in patients' pain scores from pre-injection to post-injection. Outliers are not shown

