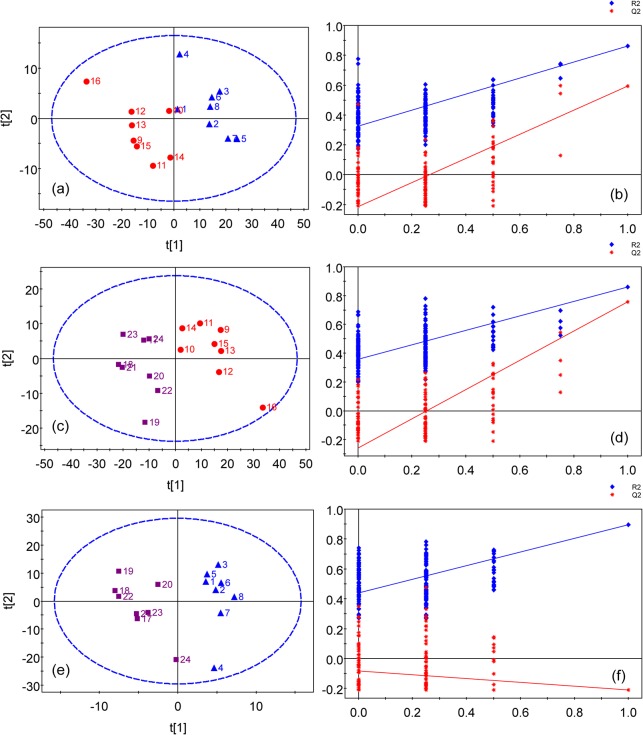
Fig 3. PLS-DA models of 1H NMR serum spectra.
(a) scores plot of the control and model groups(R2 = 71.2%, Q2 = 62.9%) with one PLS-DA component and (b) permutation test for model in (a); (c) scores plot of the copper-laden model and model+PA groups (R2 = 85.9%, Q2 = 75.7%) with 2 components and (d) permutation test for model in (c); (e) scores plot of the control and model+PA groups (R2 = 90.4%, Q2 = 21.0%) with one component and (f) permutation test for model in (e). Colored symbols: Blue triangle for the control group; Red dot for the model group; Purple square for the model+PA group. Blue diamond is denoted as R2; Red star is denoted as Q2. The ellipse shows the Hotelling’s T2-range (at a significance level of 0.05).

