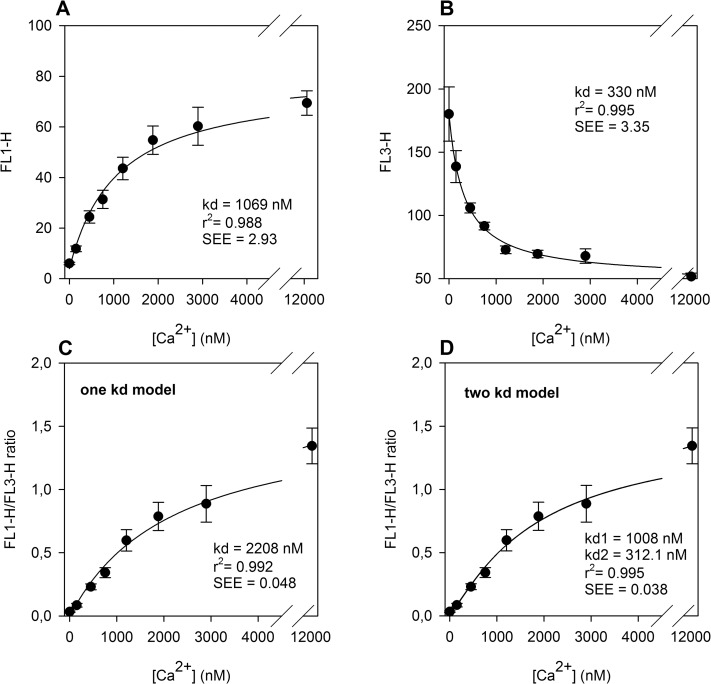
Fig 1. Determination of apparent cellular kd values for Fluo-4 and Fura Red in platelets.
(A) Fitting of a single kd model (Equation 7A) to mean FL1 data of standard samples (Fluo-4). (B) Fitting of a single kd model (Equation 7B) to the mean FL3 data of standard samples (Fura Red). (C) Determination of a “mean” cellular kd for both dyes by fitting the “one kd” model (Equation 4) to the mean FL1/FL3 ratios. (D) Determination of kd values for Fluo-4 (kd1) and Fura Red (kd2) by fitting the “double kd model” (Equation 9) for mean FL1/FL3 ratios. The corresponding kd, r2 and the standard errors of esteems (SEE) are given as insets. All data are shown as means +/- S.E.M. (n = 6).

