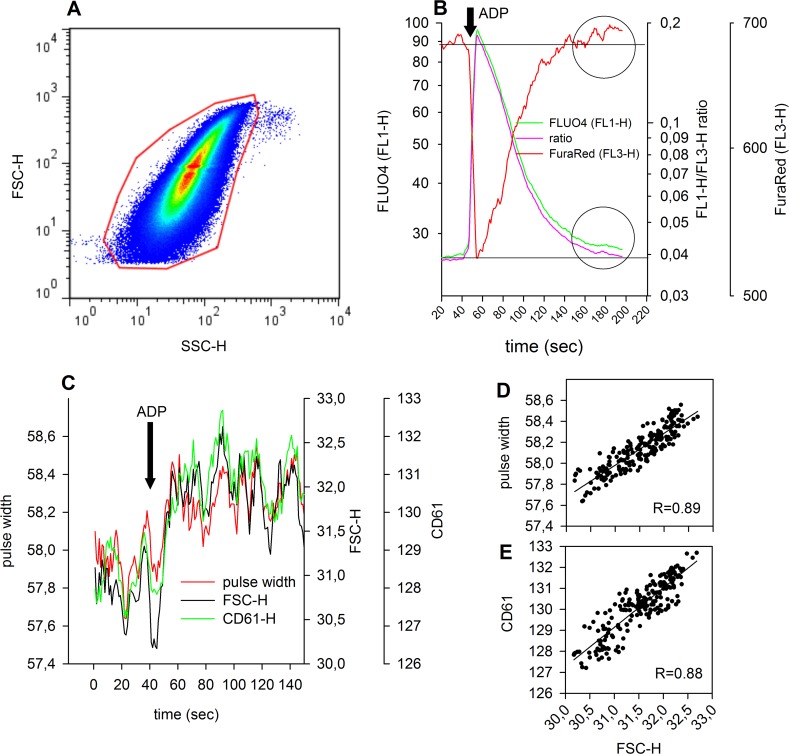
Fig 3. Alterations of detected events in size, pulse width and fluorescence over time: (A) density dot plot of FSC/SSC; red gate = platelet population.
(B) Time average of FL1 (Fluo-4, green), FL3 (Fura Red, red) and FL1/FL3 ratio (pink) before and after addition of ADP at 45 seconds, as indicated by an arrow. FL1 and FL1/FL3 ratio are depicted in a way as such that basal, as well as maximum responses are super imposable in the graph. Horizontal dotted line represents the basal unstimulated levels of FL1 and FL1/FL3 ratio. Horizontal dashed line shows the basal FL3 level. Two circles indicate the deviation from baseline of FL1 and FL3, respectively, which cannot be seen with the FL1/FL3 ratio, about 120 seconds after ADP stimulation. (C) Time averaging of FSC, pulse width and CD61 (FL4) events (medians). Addition of ADP is indicated by an arrow. (D) Correlation between pulse width and FSC during ADP stimulation in platelets. (E) Correlation between CD61 (FL4) and FSC during ADP stimulation in platelets. In (D) and (E) the solid line illustrates the correlation between the parameters as a linear regression line. The corresponding correlation coefficients are given as insets.

