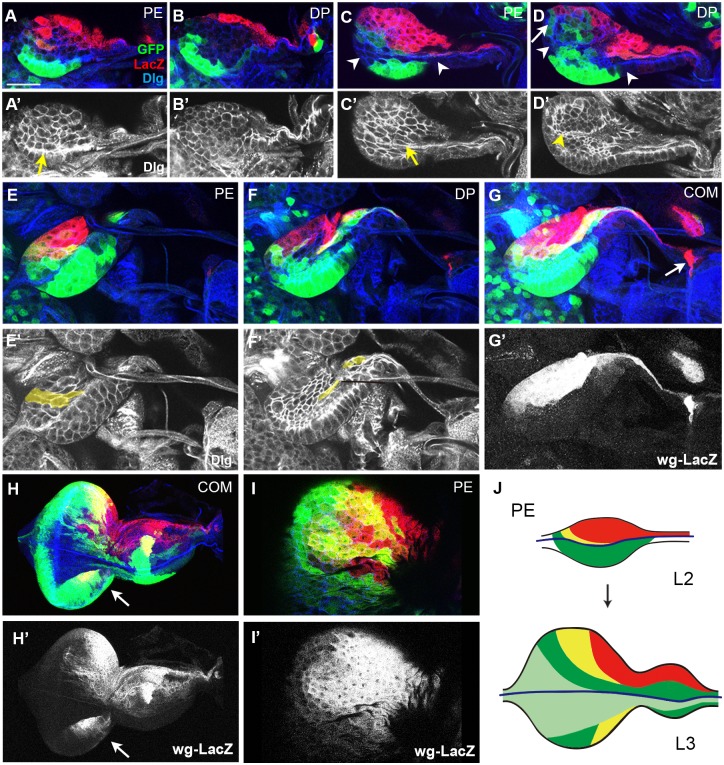
Fig 2. Growth of the ead from the late L1 to the mid-L3 stage.
Cell boundaries visualized with anti-Dlg antibody are shown in A’-F’. (A, B) Late L1 ead. Bolwig’s nerve is marked with a yellow arrow in A’. (C, D) Bolwig’s nerve in PE (C, C’) and a groove in DP (D, D’) layers are marked with yellow arrow and arrowhead in an early L2 ead, respectively. The white arrow indicates dorsal dpp-Gal4+ cells in DP. (E-G) Midline cells (yellow) in PE (E) and DP (F) during mid-L2 stage are painted yellow in E’ and F’. Combined image shows dorsal pouch as the origin of wg-LacZ+ cells in G (arrow). wg-LacZ pattern is shown in G’. (H) A mid-L3 ead. Another new wg-LacZ+ cells are appeared on ventral region in H (arrow). (I) Dorsal PE region in (H) is magnified, and black and white images of wg-LacZ (H’, I’) are shown. (J) A diagram showing the changes in PE layer of ead during L2 and L3 stages. Scale bar: A-G, 20 μm; H, 90 μm; I, 50μm.

