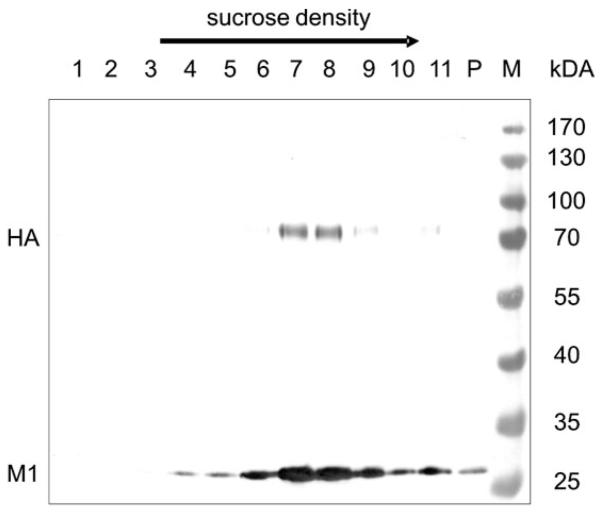
Figure 1.
Western blot of BTI-TN5B1-4 cell culture-derived A/California/04/2009 VLPs in a discontinuous sucrose density gradient (20–60% sucrose). The blot was developed using anti-M1 and anti-H1 mAbs and an alkaline phosphatase-conjugated anti-mouse IgG mAb, respectively. Lane 1 is the top fractions with the lowest sucrose concentration, lane 11 harbors the highest sucrose concentration, P indicates the pellet. Positions of HA and M1 are indicated.

