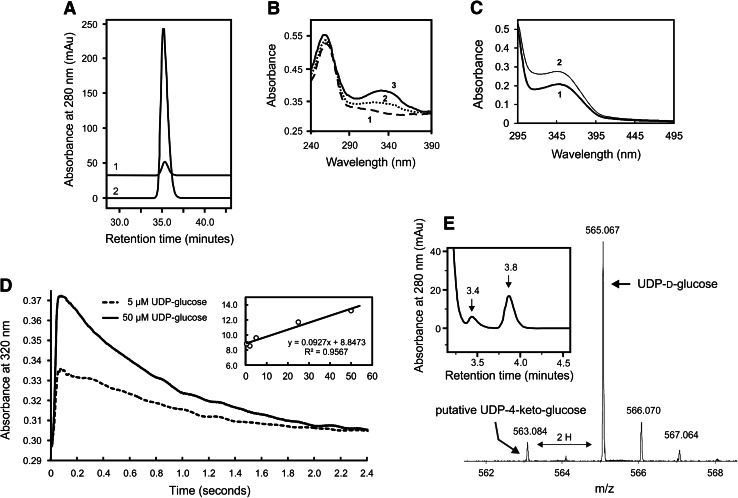
Fig. 6.
Cofactor analysis and kinetics of NAD+ reduction of UDP-d-glucose. a RP-HPLC analysis of NAD+ extracted from Agl3 in oxidized form (graph 1) compared to NAD+ reference (graph 2). b Absorption spectra of the extracted cofactor in the fully oxidized (NAD+; spectrum 1) and reduced (NADH) state. Reduction was mediated by glucose dehydrogenase and glucose. Spectra were recorded after 2 min (spectrum 2) and 5 min (spectrum 3). c Absorption spectrum of Agl3 in the resting state (spectrum 1) suggesting a mixed oxidation state of the tightly bound cofactor. Spectrum 2 is formed immediately after addition of 50 μM UDP-d-glucose. d Stopped-flow analysis of the reduction of the bound NAD-cofactor by UDP-d-glucose. Two representative time traces for the reaction between 2 μM Agl3 and 5 or 50 μM UDP-d-glucose are depicted. The first rapid increase at 320 nm depends on the UDP-d-glucose concentration. The inset shows the corresponding plot of the k obs values for this reaction versus the concentration of the electron donor. e RP-HPLC analysis and MS analysis of a new reaction product at 3.4 min retention time (HPLC graph) and a molecular mass of 563 gram/mole (mass spectrum), extracted during the conversion of UDP-d-glucose to UDP-d-glucose-5,6-ene by chloroform in the absence of sulfite and at an Agl3 concentration of 2.7 mg ml−1

