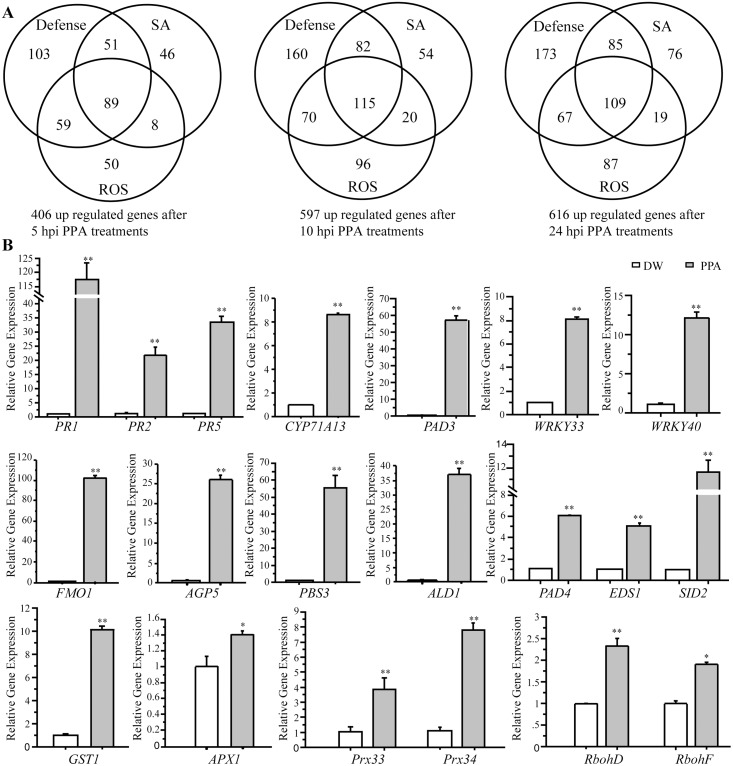
Fig 2. Induction of gene expression by PPA treatment.
A, 20-day-old plants were treated with 80 μM PPA and tissues were harvested at 0 h, 5 h, 10 h, 24 h. Using ANOVA (P<0.05) and a 2-fold change cutoff (Log2≥1), we identified genes with altered expression. The Venn diagram shows clusters of up-regulated genes in PPA treatment at 5 h, 10 h and 24 h by screen conditions (Gene Ontology term): Defense, SA, and ROS. B, Expression levels of indicated genes in response to 40 μM PPA treatment for 2 days in 20-day-old Arabidopsis leaves. Total RNA was extracted for qRT-PCR. ACT2 (At3g18780) was used as an internal control. Gene expression values are presented relative to average levels in distilled-water (DW) treated leaves (set as 1). The statistical significance of the difference was confirmed by Student's t-test (*P<0.05, **P<0.01). Data represent the means ±SE from triplicate reactions in each experiment. This experiment was repeated three times with similar results using independent samples. The primers used for this analysis are provided in S3 Table.

