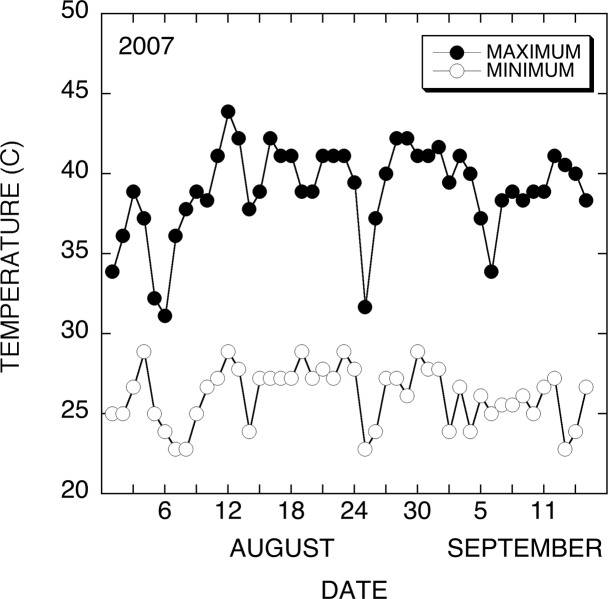
Fig 13. Field air temperatures during evaluation of boll accumulation.
This graph shows the maximum and minimum air temperatures in Maricopa, Arizona during the 2007-growing season. Temperatures over 38°C were common throughout the flowering and boll development period. The Bar line indicates the time period where the opened bolls were set.

