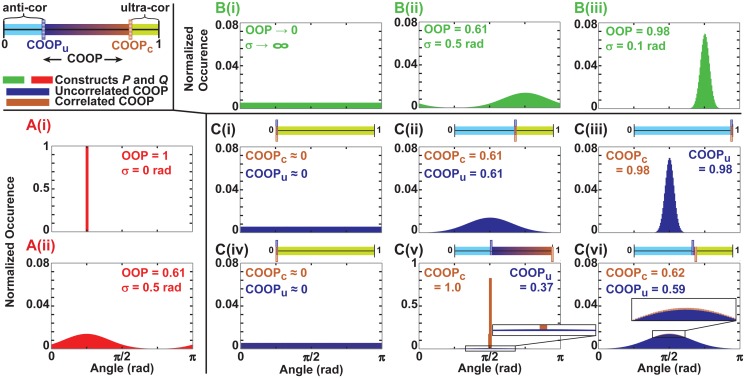
Fig 3. Boundaries of normal region of the COOP.
(A and B) The orientation distribution for construct A and B respectively with both the standard deviation of the truncated Gaussian distribution and OOP indicated for each case; (C) the distribution of the angles between the two constructs if they are independent of each other (dark blue) and if the difference is dictated by a random noise (brown). For each case the boundaries, COOPu and COOPc, are indicated. Sliders show this graphically with regions colored according to the legend.

