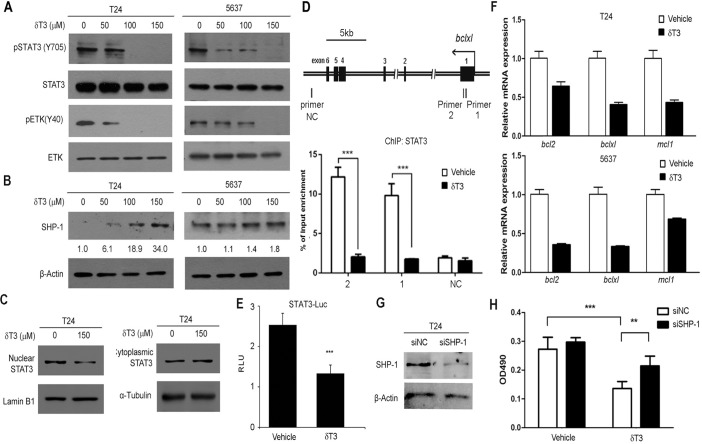
Fig 5. δ-T3 suppresses STAT3 signaling pathways in human bladder cancer cells.
Western blotting analysis of the STAT3/ETK signaling pathway-related (A) and SHP-1 (B) protein levels in T24 and 5637 cells under the δ-T3 treatment for 24 h. Western bands were quantified by Image J software and the digits shown below the upper panel were the relative STAT3 expression levels normalized by loading controls. (C) Reduction of nuclear STAT3 protein level upon the treatment of 150 μM δ-T3 in T24 cells. LaminB1 was used as a nuclear loading control. Tubulin was used as a cytoplasmic loading control. (D) Genomic structure of bclxl gene was shown, with the labels of three primer sets for ChIP assay. Primer set 1 and 2 contain STAT3 binding element; whereas primer set 3 (NC) serves as negative control. STAT3 occupancy in the bclxl promoter in bladder cancer cell line T24 treated with 150 μM δ-T3 or vehicle for 18 h were assayed by ChIP assay. Input DNA and immunoprecipitated DNA were analyzed by qPCR analyses using primer sets depicted above and normalized by IgG control. The error bar indicates the means ± SD. ***, P < 0.001. (E) δ-T3 treatment reduced the STAT3 downstream target genes (bcl2, bclxl and mcl-1) expression at mRNA level. (F) Luciferase activity analysis of STAT3-Luc upon the treatment of 150 μM δ-T3 in T24 cells for 24 h. TK-Renilla luciferase plasmid was used as internal control. (G) Knockdown efficiency of SHP-1 in T24 cells by Western blotting assay. β–Actin was used as internal control. siNC, negative control siRNA. siSHP-1, siRNA targeting to SHP-1. (H) T24 cells were treated with siRNA to SHP-1 or siNC, followed by treatment with δ-T3 or vehicle. Cell viability was tested by MTT assay. **, P < 0.01; ***, P < 0.001.

