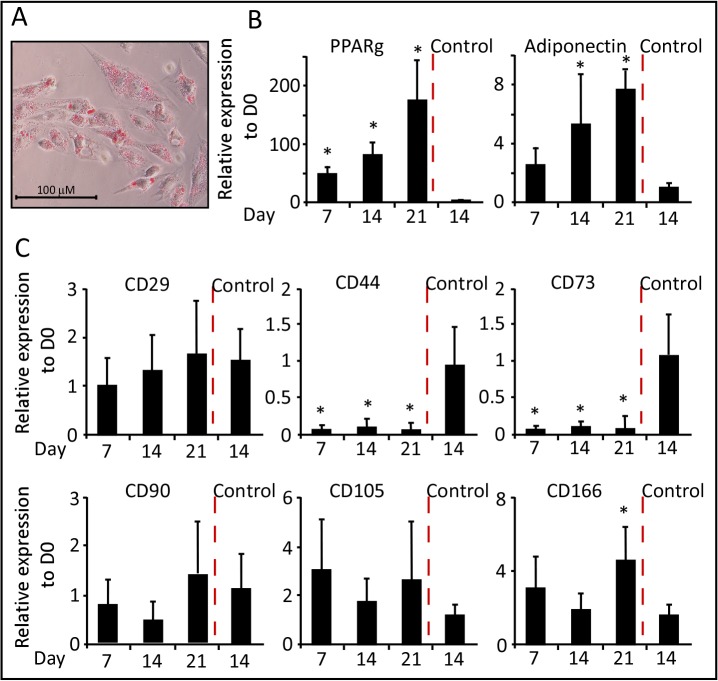
Fig 3. Adipogenic differentiation of WJ-MSCs.
(A) Representative staining of adipocytes with Oil Red-O stain (200X). (B) and (C) qRT-PCR was performed after the induction of adipogenic differentiation of WJ-MSCs. Results for all panels were expressed as fold-change relative to Day 0—undifferentiated WJ-MSCs (n = 3, *p < 0.05).

