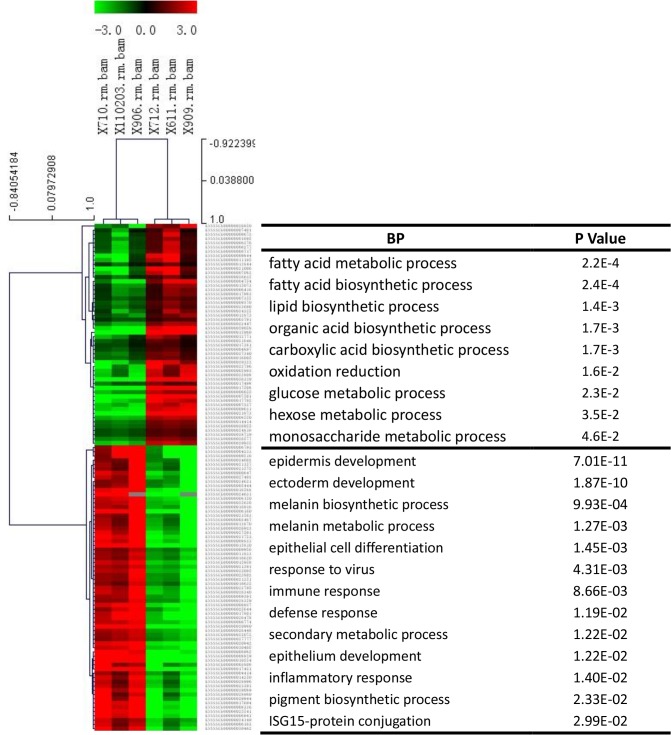
Fig 5. Heatmap of differentially expressed genes (DEGs) in adipose tissue and GO analysis.
The heatmap was generated by hierarchical cluster analysis of DEGs. The processes listed opposite the upper half of the heatmap are gene ontology annotation processes of the up-regulated genes [biological process (BP)]. The lower processes are those (BP) of the down-regulated genes.

