
Fig 7. The venn diagram of SNPs and Indels in BH and BL.
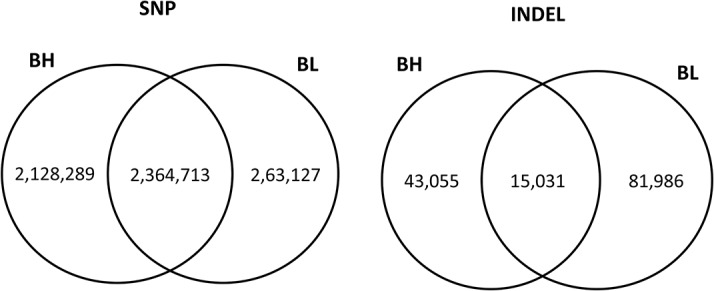
The number of SNPs and Indels in genome located in BH and BL groups.
Official websites use .gov
A
.gov website belongs to an official
government organization in the United States.
Secure .gov websites use HTTPS
A lock (
) or https:// means you've safely
connected to the .gov website. Share sensitive
information only on official, secure websites.
The number of SNPs and Indels in genome located in BH and BL groups.