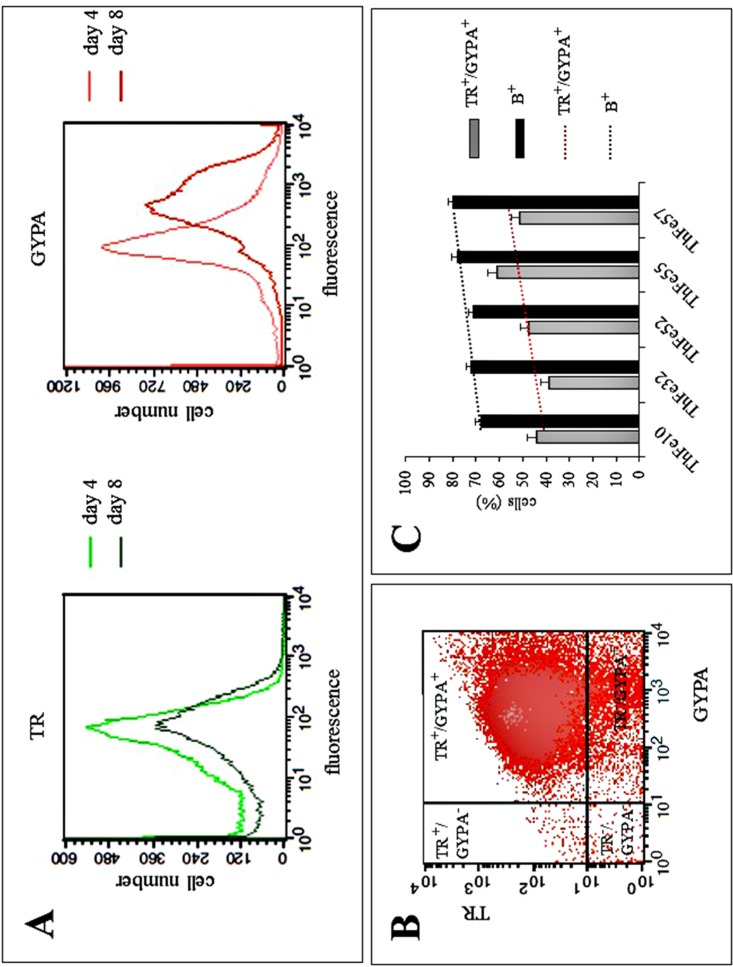
Fig 1. Expression of transferrin receptor (TR) and Glycophorin A (GYPA) in ErPCs analyzed by flow cytometry.
(A) FACS analysis of TR (green) and GYPA (red) antibody binding to ErPCs isolated after day 4 and day 8 of cell culture. (B) Relationship between TR and GYPA expression in day 4 ErPCs cultures. (C) Comparison of TR+/GYPA+ and B+ (benzidine-staining positive) cells in ErPCs from different β-thalassemic patients (n = 5, p<0.05).

