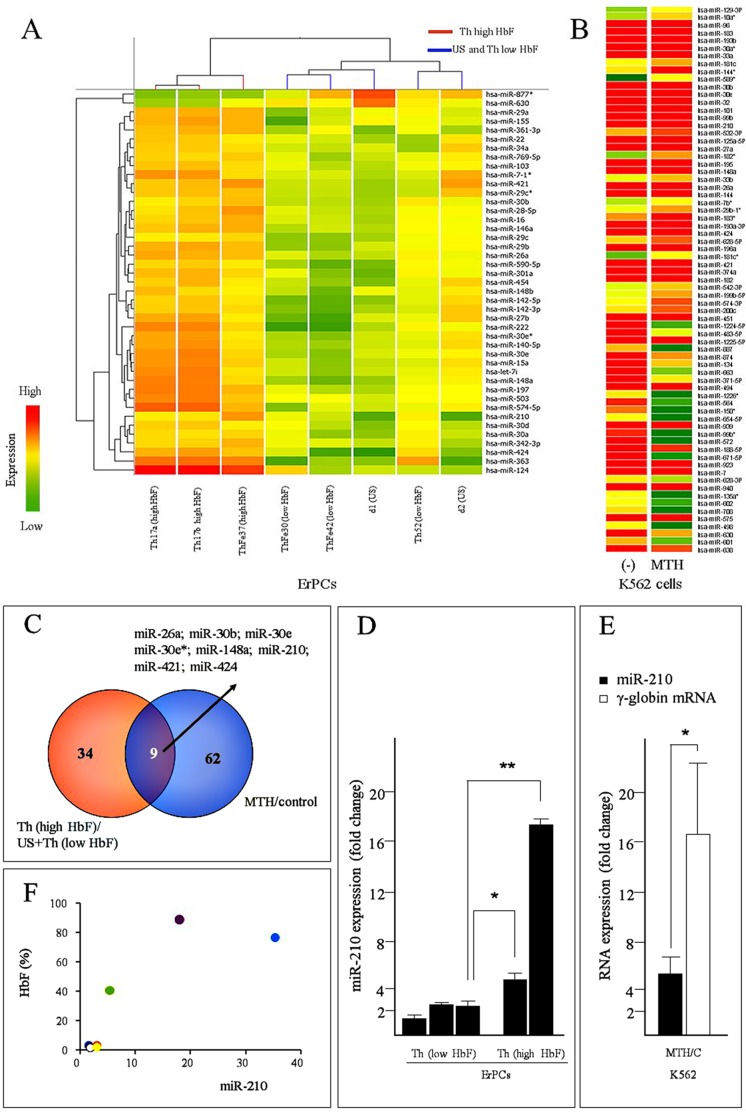
Fig 2. MicroRNAs modulated in ErPCs from β-thalassemia patients and healthy donors and in K562 cells induced to erythroid differentiation by MTH.
(A) Hierarchical clustering of ErPC samples from β-thalassemia patients and healthy donors (unaffected subjects, US). These samples were clustered according to the expression profile of the 43 microRNAs differentially expressed in samples from β-thalassemia patients with high HbF (Th17a, Th17b, ThFe37), with low HbF (ThFe30, ThFe42, ThFe52) and healthy donors (d1-US, d2-US). Different sample subtypes are indicated with color bars (red, high HbF; blue, US and low HbF). The differential expression of microRNAs can be easily followed by a color-code approach, indicating with green low levels, and with red high levels of microRNA content. (B) Heat map of the 71 microRNAs up- or down-regulated in K562 cells following MTH treatment. (-) = K562 cells untreated control. (C) Common microRNAs modulated in Th (high HbF) vs. Th (low HbF) plus US samples and in MTH-induced K562 vs. uninduced cells. (D) MicroRNA-210 expression analyzed by RT-qPCR in RNA samples from two Th (high HbF) ErPCs and three Th (low HbF) ErPCs. The data are represented as fold change with respect to ErPCs from healthy subjects (* = p<0.05; ** = p<0.01). (E) Changes of microR-210 (black) and γ-globin mRNA (white) expression in MTH-induced K562 cells in five independent experiments (* = p<0.05). The data represent fold change with respect to control untreated K562 cells. MicroRNA-let-7c (equally expressed in the samples) and 18S were used as internal reference gene sequences to normalize RNA input. (F) Correlation between microRNA-210 content in ®-thalassemia patient ErPCs (analyzed by RT-qPCR with respect to healthy subjects) and %HbF (analyzed by HPLC) in peripheral blood.

