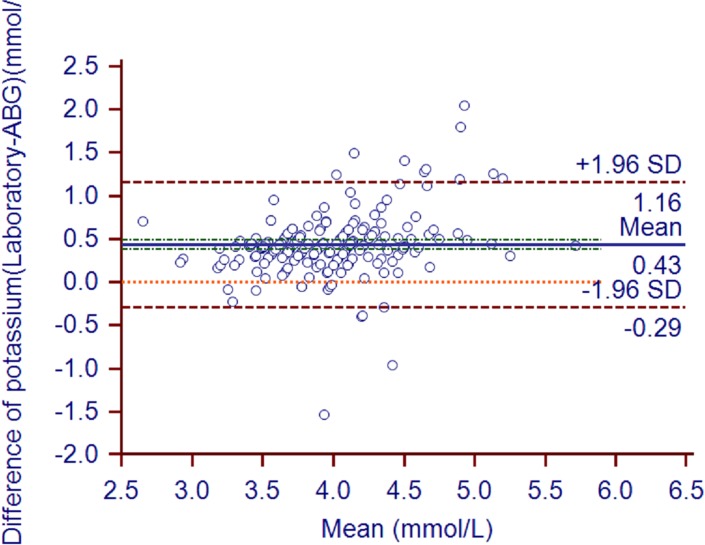
Fig 1. Potassium bias plot.
Bland and Altman plot shows the potassium bias of each pair of samples (in mmol/L). The solid line indicates the mean bias and the value is 0.43. The green line indicates 95%CI of mean bias (0.38 to 0.48). The brown line indicates the 95% LOA of the bias (-0.29 to 1.16). The orange line indicates zero line.

