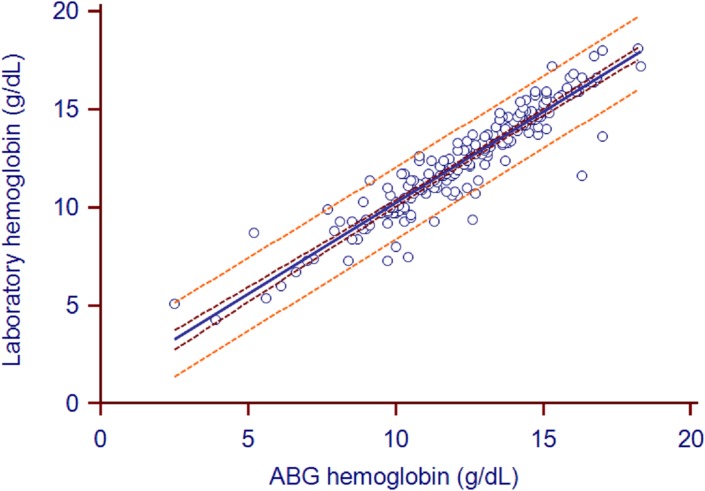
Fig 6. Hemoglobin scatter plot with Deming fit.
Concordance plot shows agreement between laboratory- and ABG-measured hemoglobin (in g/dL). The solid line indicates the correlation coefficient (r = 0.94). The brown line indicates the 95%CI of correlation coefficient (0.92 to 0.95). The orange line indicates the 95%LOA.

