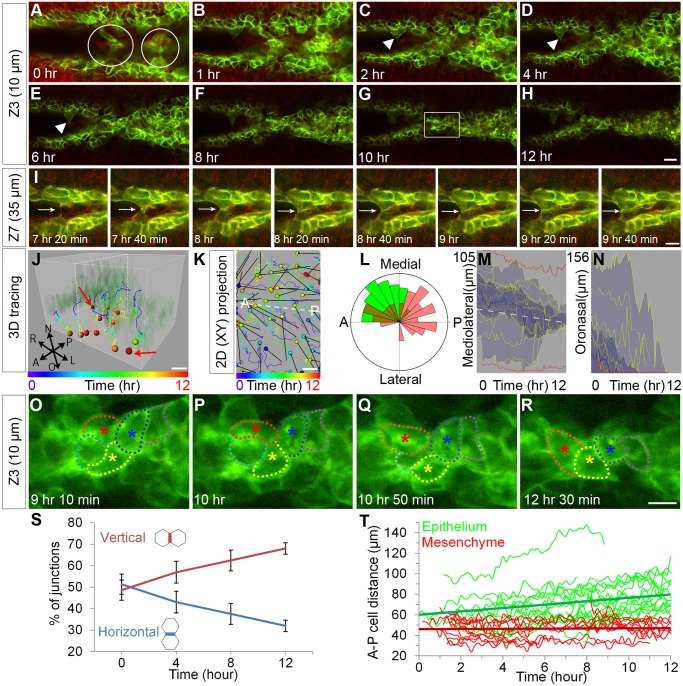
Fig 1. Cellular protrusions and cell intercalation during initiation of palatal fusion.
(A–H) Confocal time-lapse imaging of K14-Cre; ROSA26 mTmG/+ palatal explant cultures reveals initial contacts made by cellular protrusions (white arrowhead) from each epithelium that form cellular bridges (white circles in A). Over the 12-hour imaging period, a multicellular epithelium becomes integrated into a single shared MES. Scale bar, 20 μm. (I) Higher magnification view of deeper optical sections reveals membrane extension and junction formation during palatal adhesion. Scale bar, 10 μm. (J) 3-D tracking and (K) 2-D tracking of cells in projection from all optical sections shows that epithelial cells in the MES converge toward the midline and displace toward the oral surface. The colors of the tracks indicate time; the colors of spheres indicate the last time points at which cells could be tracked. Dashed white lines in J and K indicate the plane of the MES. In K, displacement is shown with black arrows. Scale bar, 10 μm. A: anterior, P: posterior. (L) Rose diagram indicating angle of displacement for tracked cells (green, epithelium; red, mesenchyme) (M) Vantage plot of mediolateral position over time indicates that cells are converging to the midline. The approximate position of the MES midline is shown with a white dashed line. (N) Vantage plot of oronasal position over time indicates oral displacement of MES cells. In M, N the yellow lines are individual cell positions, the thick blue line is the median of the cell movements, the dark blue area is a range between the lower quartile and upper quartile, and light blue indicates the maximum range for 30 cells. Red lines are mediolateral (M) and oronasal (N) positions of lateral epithelial reference cells. (O–R) High magnification of time-lapse imaging in the region indicated in (G) outlines cells engaged in neighbor exchange. Scale bar, 10 μm. (S) Relative abundance of horizontal (-30°-30° to midline) and vertical (60°–120° to midline) junctions over the time course of palate fusion. Lines represent percentage of each junction type over n = 7 sections (relative mean ± SEM) (T) Distance between neighboring epithelial cells along the medial edge (green) or mesenchymal cells neighboring parallel to the medial edge (red). Linear best fit trend lines for the average distance are shown by straight green and red lines. Please see S1 Data for raw data.

