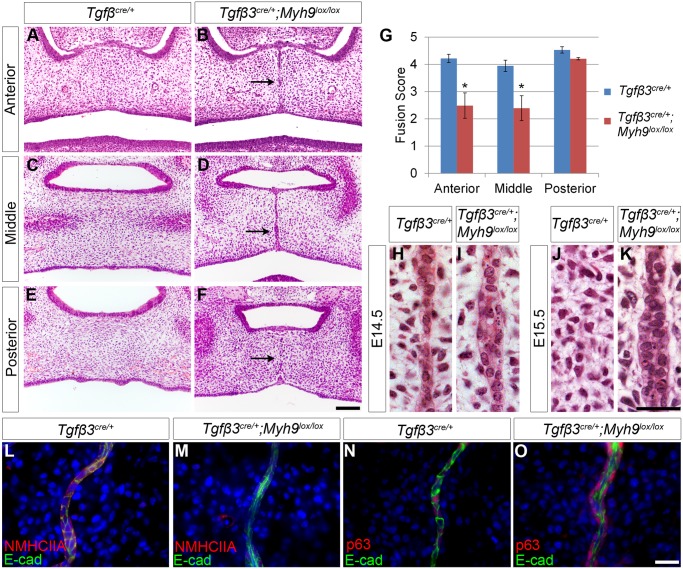
Fig 2. Epithelial loss of NMHCIIA causes defects in MES cell intercalation and MES persistence during palatal fusion.
(A–K) Myh9 deletion by Tgfβ3 cre/+ results in persistent MES cells upon loss of epithelial Myh9 (B, D, F) compared with control (A, C, E) at E15.5. The observed defects were most severe in the anterior (B) and middle (D) regions of the palate. Scale bar, 100 μm. (G) Mean fusion scores were significantly reduced in Tgfβ3 cre/+;Myh9 lox/lox palates compared with Tgfβ3 cre/+ controls. (H–K) High magnification images of histological sections of the MES region revealed that the midline MES is maintained as a multi-layered structure in TgfB3 Cre/+; Myh9 lox/lox embryos at E14.5 (I) and E15.5 (K), while the control MES region has a thin MES at E14.5 (H) and no MES at E15.5 (J). Scale bar, 50 μm. (L, M) Immunostaining for NMHCIIA and E-cadherin indicates that NMHCIIA expression was lost in the multilayered MES of Tgfβ3 cre/+; Myh9 lox/lox mutant E14.5 embryos (M) compared with control (L). (N, O) p63 expression was detected in the multilayered MES of Tgfβ3 cre/+;Myh9 lox/lox mutant E14.5 embryos (O) as well as control embryos (N). In G, data are presented as mean fusion score ± SEM. *p < 0.05, Student’s t test, n = 3. Please see S1 Data for raw data.

