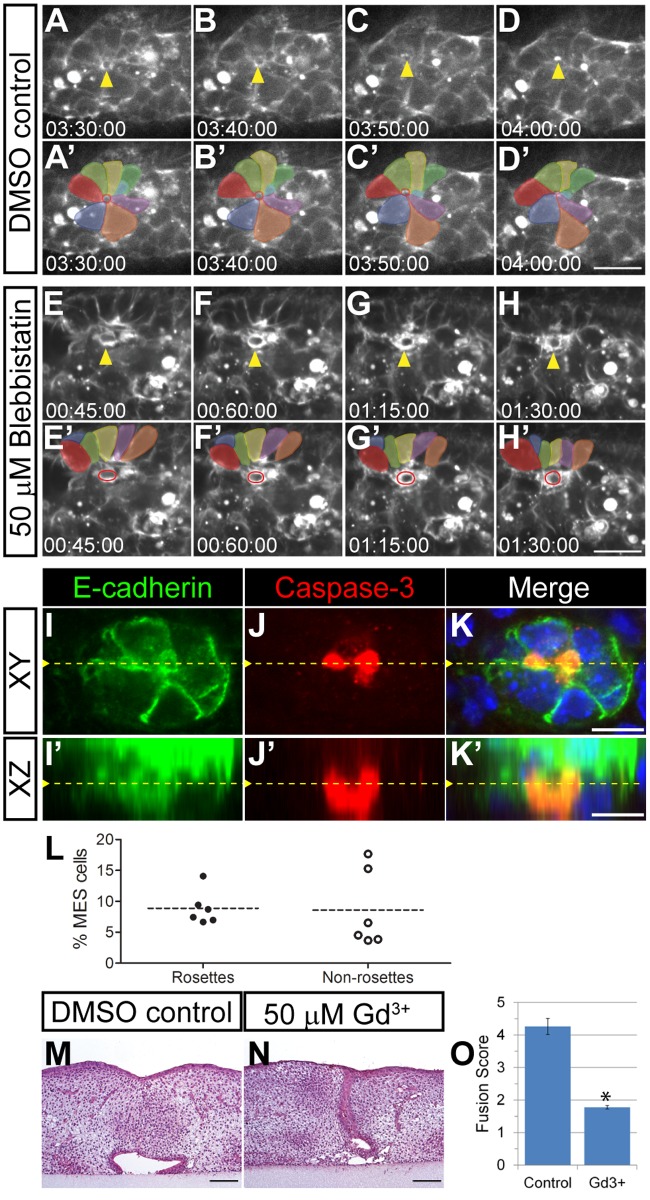
Fig 6. Multi-cellular rosette formation and cell extrusion during secondary palatal fusion.
(A–D, A’–D’) An example of rosette formation (colored) and cell extrusion in high magnification confocal live imaging of Lifeact-mRFPruby palatal explants. The extruding cell is marked by a yellow arrowhead (A–D) and red circles (A’–D’). Scale bar, 10 μm. (E–H, E’–H’) Disrupted rosette formation is observed upon inhibition of NMII with blebbistatin. The few extrusion-like events that were observed in blebbistatin-treated palate explant cultures did not exhibit well-formed rosettes. Surrounding rosette cells are labeled with different colors. A cell initiating extrusion is indicated by yellow arrowheads (E–H) and red circles (E’–H’). Scale bar, 10 μm. (I–K, I’–K’) Immunostaining for E-cadherin (I, I’) and cleaved caspase-3 (J, J’) indicate that extruding cells are undergoing apoptosis. Orthogonal projection of a confocal Z-stack from which (I–K) are derived shows cell extrusion at the oral side of the MES toward the oral cavity. Yellow dashed line in (I–K) indicates the Y position of (I’–K’); yellow dashed line in (I’–K’) indicates the Z position of (I–K). (L) Percentage of MES cells that are apoptotic. Dotted lines represent the mean of cleaved caspase-3 positive cells as a percentage of total MES cells. (M–O) Treatment with 50 μM gadolinium results in failure of palatal shelf fusion in explants cultured for 72 h (N, O) compared with control (M, O) presented as mean fusion score ± SEM. * p < 0.05, Student’s t test, n = 3. Scale bar, 100 μM. Please see S1 Data for raw data.

