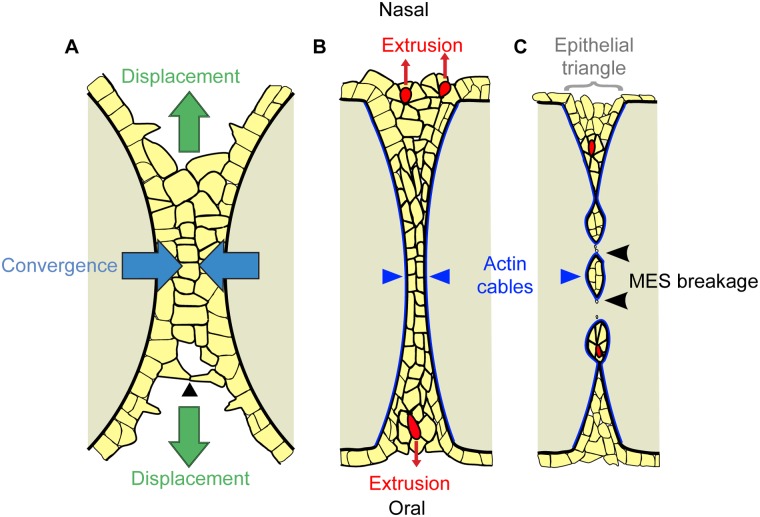
Fig 7. Model of cellular dynamics in palatal fusion.
(A–C) Schematic diagram of frontal sections of the MES at progressive stages of palatal fusion. Yellow represents epithelium, tan represents mesenchyme, and red represents extruding cells. (A) Palatal fusion is initiated by cellular protrusions reaching across to form junctions with the apposing shelf (arrowhead). Convergence of the multilayered epithelium toward the midline (blue arrows) is concurrent with oral and nasal displacement of MES epithelium (green arrows). (B) Multicellular actin cables (dark blue) form laterally around the seam as it intercalates to a common MES structure. Formation of multicellular rosettes and cell extrusion (red cells) releases MES cells to the oral and nasal surfaces of the palate. (C) The multicellular actin cables contract, contributing to MES breakage (black arrowheads), and cell extrusion events in the epithelial triangles (grey bracket) continue to remove epithelial cells from the MES.

