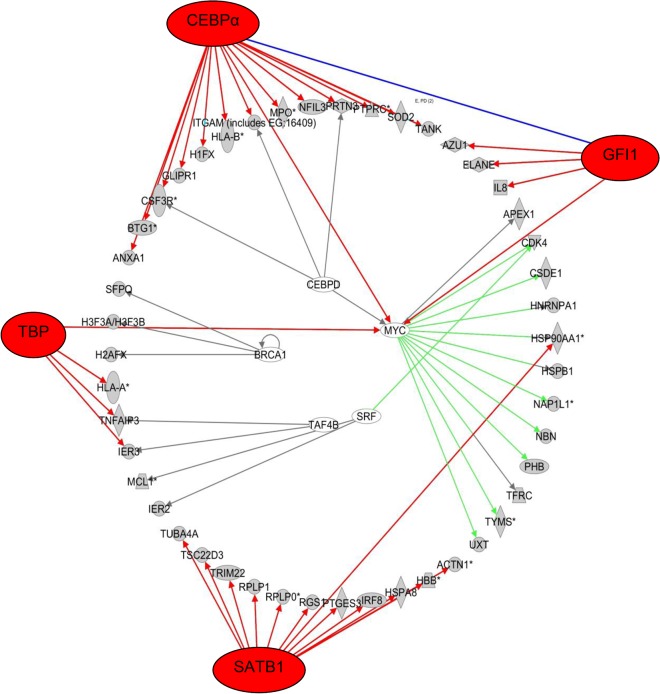
Fig 4. Transcription network visualization plot for patient 3.
Transcription network plot showing transcription factors (outer ring/ inner ring) that are predicted responsible for differential expression of shown target molecules (middle ring) between diagnosis and relapse of patient 3. A few transcription factors (CEBPA, GFI1, SATB1 and TBP) are responsible for the major changes in the differentially expressed target molecules.

