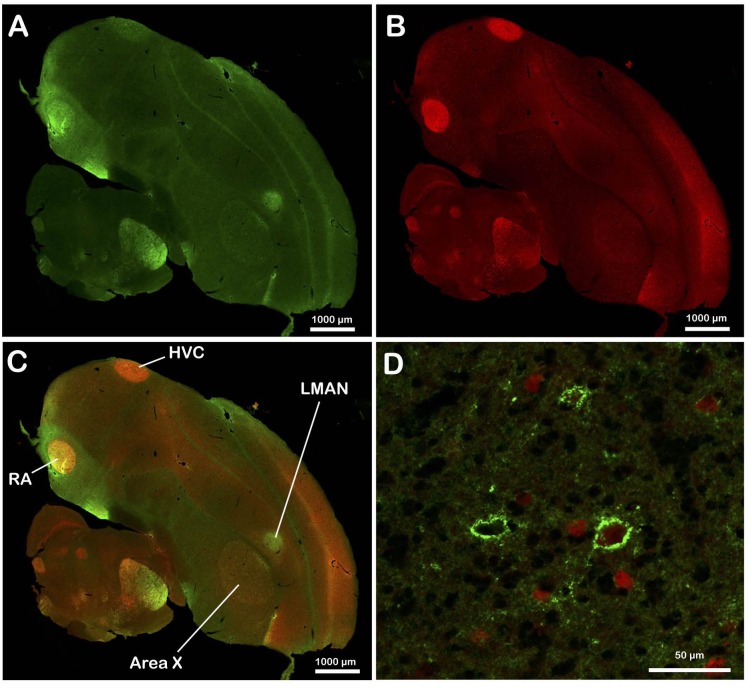
Fig 1. Representative photomicrographs illustrating the distribution of chrondroitin sulfate immunoreactivity and of parvalbumin-immunoreactive cells in parasagittal sections of the male zebra finch brain.
Panels A through C illustrate at low magnification the chrondroitin sulfate (A) and parvalbumin (B) distribution as well as the overlay of the two signals (C). Panel D illustrates a few PNN surrounding or not parvalbumin-immunoreactive cells in Area X.

