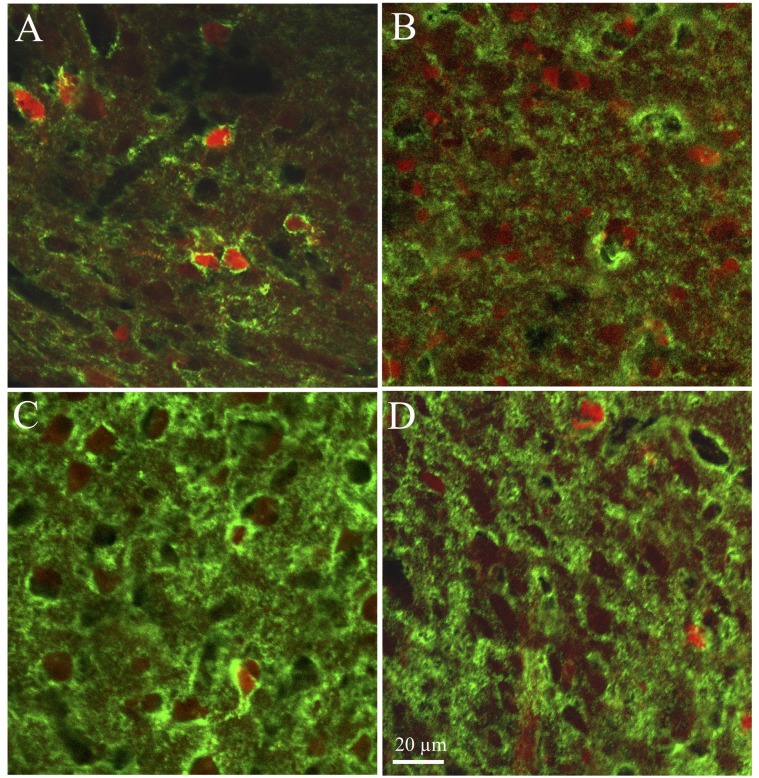
Fig 3. Representative photomicrographs illustrating the distribution of chrondroitin sulfate immunoreactivity (Green signal) and of parvalbumin-immunoreactive cells (red signal) as observed in in parasagittal sections of male (C, C) and female (B, D) zebra finch brains.
Panels A_B illustrate differences in HVC, panels C-D concern RA. The magnification bar in D (20 μm) also applies to all other panels.

