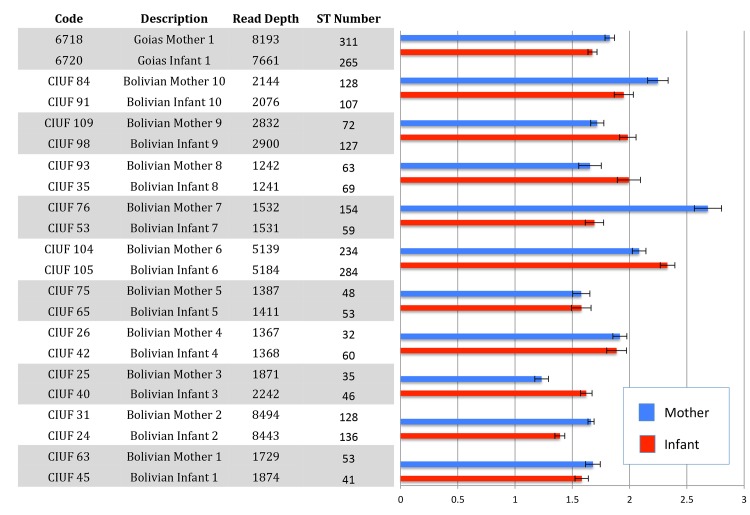
Fig 3. Alpha diversity indices for TcGP63I amplicon diversity derived from pairs of congenital Chagas disease cases.
Diversity indices were derived from STs defined at 99% sequence similarity. Bar plot and associated x-axis on the right hand side shows the Shannon diversity index calculated in Mothur [34], with error bars defining upper and lower 95% confidence intervals.

