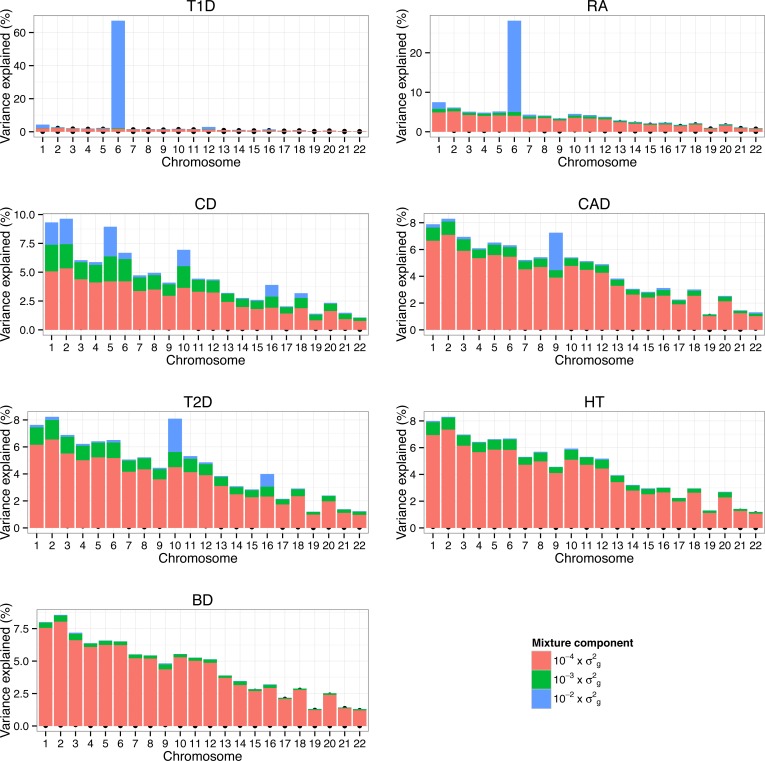
Fig 6. Proportion of genetic variance on each chromosome explained by SNPs with different effect sizes underlying seven traits in WTCCC.
Proportion of additive genetic variation contributed by individual chromosomes and the proportion of variance on each chromosome explained by SNPs with different effect sizes. For each chromosome we calculated the proportion of variance in each mixture component as the sum of the square of the sampled effect sizes of the SNPs allocated to each component divided by the sum of the total variance explained by SNPs. The colored bars partition the genetic variance in contributions from each mixture class.

