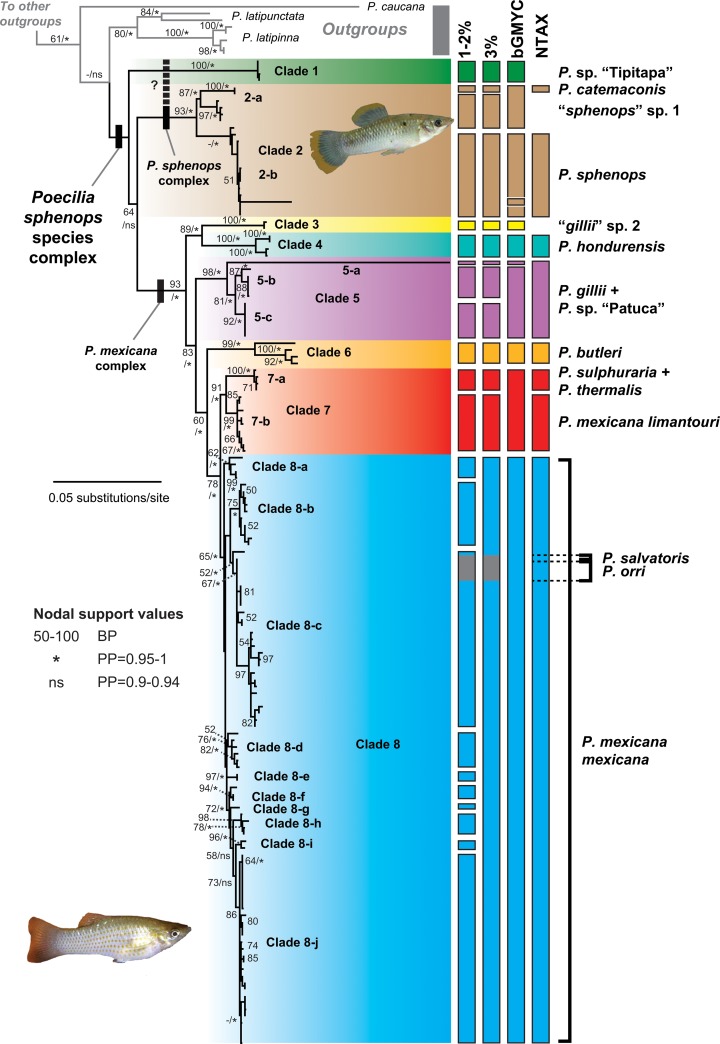
Fig 2. Results of bGMYC analysis for developing preliminary species delimitation hypotheses.
Results presented are based on the concatenated mtDNA (cytb, cox1, serine tRNA) dataset and represented on the gene tree resulting from maximum-likelihood (ML) analysis in GARLI. Nodal support values are ML bootstrap proportions (BP; ≥50%)/Bayesian posterior probabilities (PP; ≥0.95). Colored bars to the right of the phylogeny represent hypothesized species groupings based on ≥0.9 Bayesian posterior probability of conspecificity (calculated from Bayesian MCMC analysis of 100 post-burn-in trees from the concatenated mtDNA BEAST analysis), compared with bars demarcating clades meeting genetic distance thresholds (1–2%, 3%) and nominal taxonomy (NTAX).

