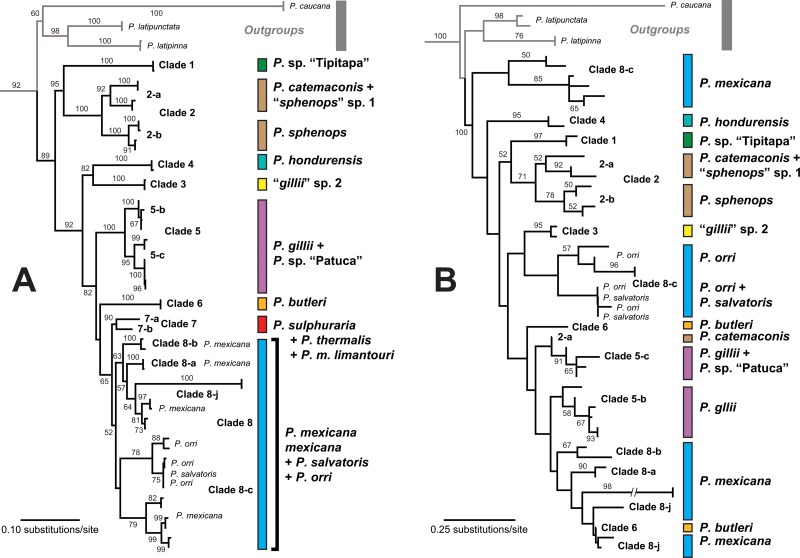
Fig 3. Gene trees derived from maximum-likelihood analyses of the concatenated mtDNA + nDNA dataset (A) and the concatenated nDNA dataset (B) in GARLI.
Numbers along branches indicate the level of nodal support from ML bootstrap proportions (BP) ≥50%. Clade names at tips and colored bars representing delimited/nominal species correspond to those shown in Fig 2.

