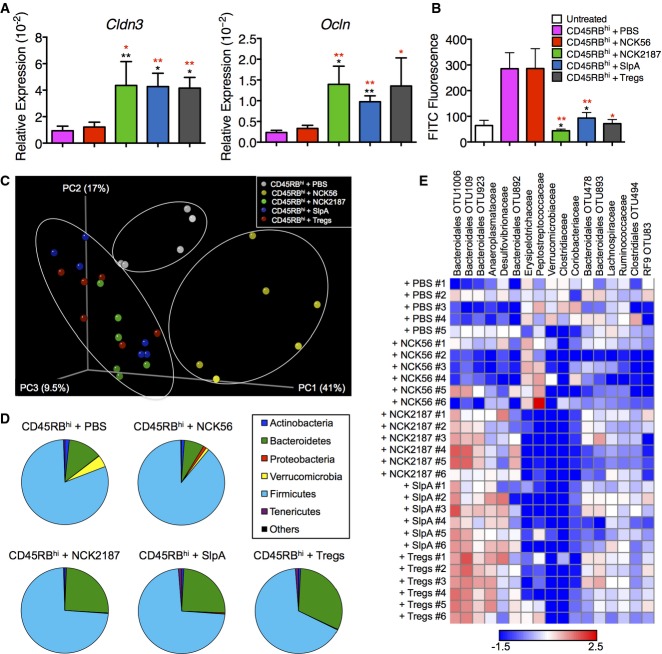
Figure 4.
Lactobacillus acidophilus NCK2187 and its SlpA protect intestinal barrier function and prevent dysbiosis in pathogenic T-cell-induced colitis
- A, B Colonic expression of tight junction-associated genes Cldn3 and Ocln, determined by RT–PCR relative to 18S rRNA (A), as well as passive transepithelial absorption of FITC-dextran (B), were used as measures of epithelial barrier integrity. Sham adoptive transferred B6 Rag1−/− mice (white bars) were used as baseline controls in some cases. n = 5 mice/group. Data represent three individual experiments and are shown as mean ± SEM. *P < 0.05, **P < 0.01. Black asterisks compare NCK2187 to PBS-treated adoptively transferred mice, and red asterisks to NCK56-treated mice.
- C UniFrac analyses were used to calculate distances between the microbial communities of the different samples (week 7), and three-dimensional scatter plots were generated by using principal coordinate analyses (PCoA). Gray dots = CD4+CD45RBhi T cells + PBS; yellow dots = CD4+CD45RBhi T cells + NCK56; green dots = CD4+CD45RBhi T cells + NCK2187; blue dots = CD4+CD45RBhi T cells + SlpA; red dots = CD4+CD45RBhi T cells + Tregs. Each dot represents the fecal microbiota data of an individual mouse.
- D Changes in the relative abundance of different phyla were also analyzed. See Supplementary Table S4 for results of statistical analyses among the different groups. Dark blue = Actinobacteria; green = Bacteroidetes; red = Proteobacteria; yellow = Verrucomicrobia; aqua = Firmicutes; purple = Tenericutes; black = others.
- E Comparison of microbial communities at family or order levels. The heat map depicts the relative value in individual mice. n = 5–6 mice/group.

