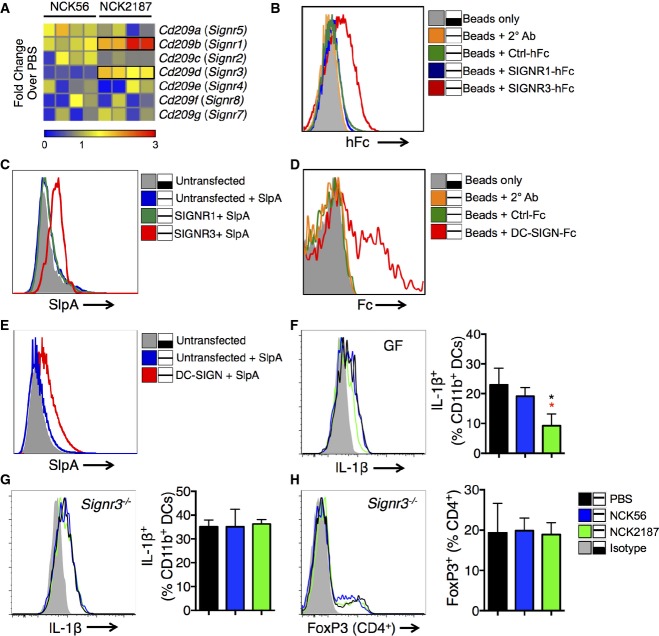
A B6 mice were orally gavaged with 109 CFU NCK56 or NCK2187, and the colonic gene expression of C-type lectin receptors were measured by RT–PCR. Each box represents an individual mouse; n = 4. Data represent three individual experiments.
B Binding of SlpA to various hFc fusion proteins was analyzed by flow cytometry. Gray tinted line = SlpA-coated beads only; orange = SlpA-coated beads + secondary antibody; green = SlpA-coated beads + control fusion protein; blue = SlpA-coated beads + SIGNR1-hFc; red = SlpA-coated beads + SIGNR3-hFc. Binding assay results were confirmed five independent times.
C Binding of SlpA to SIGNR3, but not SIGNR1 expressed by CHO-S cells. Gray tinted line = untransfected CHO-S cells; blue = untransfected CHO-S cells + labeled SlpA; green = SIGNR1-transfected CHO-S cells + labeled SlpA; red = SIGNR3-transfected CHO-S cells + labeled SlpA. Binding assays in CHO-S cells were performed three individual times.
D Binding of SlpA to recombinant human DC-SIGN/CD209-Fc chimera was analyzed by flow cytometry. Gray tinted line = SlpA-coated beads only; orange = SlpA-coated beads + secondary antibody; green = SlpA-coated beads + control fusion protein; red = SlpA-coated beads + DC-SIGN-Fc. Binding assays were performed and confirmed three times.
E Binding of SlpA to DC-SIGN expressed by CHO-S cells. Gray tinted line = untransfected CHO-S cells; blue = untransfected CHO-S cells + labeled SlpA; red = DC-SIGN-transfected CHO-S cells + labeled SlpA. Binding assays in CHO-S cells were performed three individual times.
F, G IL-1β production by colonic DCs of naïve WT B6 GF or B6 Signr3−/− (KO) mice treated with NCK56 (blue) or NCK2187 (green) four times, or left untreated (black), as determined by flow cytometry. n = 5 mice/group. Data represent four individual experiments and are shown as mean ± SEM. *P < 0.05. Black asterisks compare NCK2187 to untreated (PBS) mice, and red asterisks to NCK56-treated mice.
H Frequency of colonic FoxP3+ Tregs in KO mice treated with NCK56 or NCK2187 was measured by flow cytometry. n = 5 mice/group. Data represent four individual experiments and are shown as mean ± SEM.

