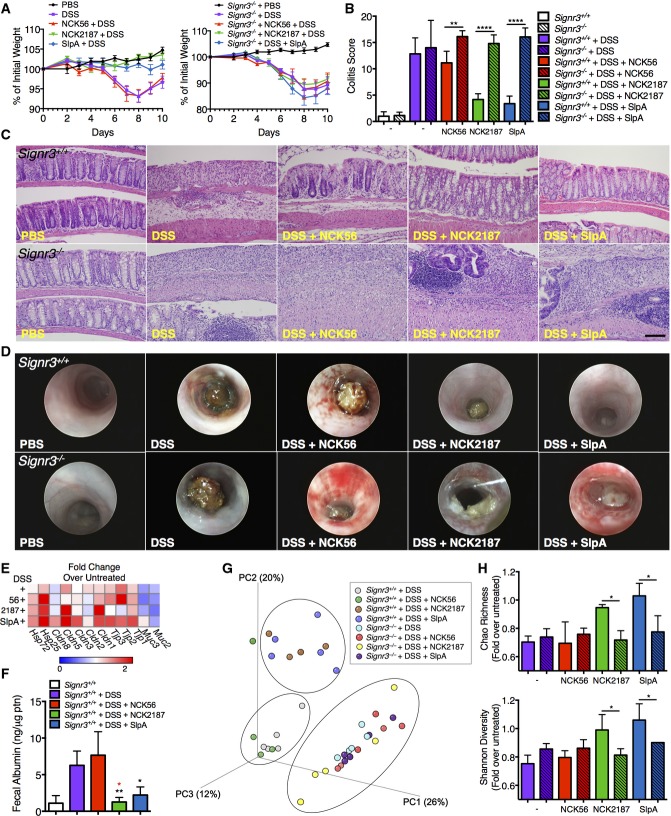
Figure 6.
Lactobacillus acidophilus NCK2187 and its SlpA do not protect against DSS-induced colitis in Signr3−/− mice
- A Colitis severity was determined in part by weight loss. n = 5 mice/group.
- B, C Colitis scores based on histopathology and gross morphology of the colons were also used as measures of disease. Scale bar = 50 μm. n = 5 mice/group. Empty bars = WT; lined bars = KO; white bars = untreated; purple bars = DSS; red bars = DSS + NCK56; green bars = DSS + NCK2187; blue bars = DSS + SlpA.
- D Colonoscopies were performed in the different groups with a Multi-Purpose Rigid™ Telescope attached to a TELE PACK X on day 10.
- E Mean relative colonic expression of tight junction-associated genes in WT mice. n = 5 mice/group.
- F Fecal albumin levels in WT mice as a measure of intestinal permeability. n = 5 mice/group.
- G UniFrac analyses were used to calculate distances between the microbial communities of the different samples (day 10), and three-dimensional scatter plots were generated by using PCoA. Light gray: WT + DSS; green: WT + DSS + NCK56; brown: WT + DSS + NCK2187; blue: WT + DSS + SlpA; aqua: KO + DSS; red: KO + DSS + NCK56; yellow: KO + DSS + NCK2187; purple: KO + DSS + SlpA. n = 4–6 mice/group.
- H Species richness and microbial diversity in DSS-treated mice. Top: The Chao richness index was used as a measure of species richness. Bottom: The Shannon diversity index was used to estimate microbial diversity for each group. n = 4–6 mice/group. Color coding is as in (B).

