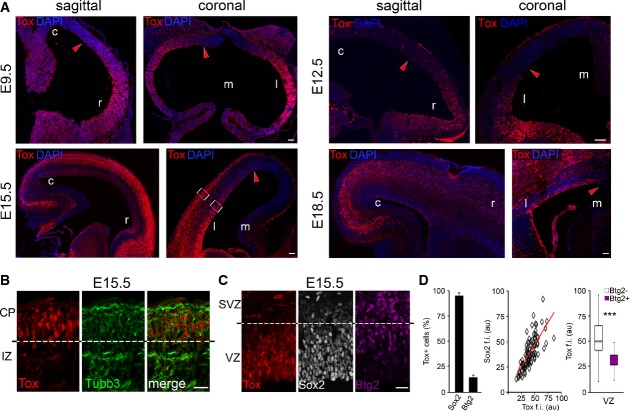
Figure 1.
- A-C Fluorescence pictures of WT (A and B) or Btg2RFP (C) mouse brains at E9.5, E12.5, E15.5 or E18.5 (as indicated) after immunohistochemistry for Tox (A-C; red), Tubb3 (B; green), Sox2 (C; white) or RFP (C; magenta) and DAPI counterstaining (A; blue).
- D Quantification of Sox2+ or Btg2RFP+ cells within the Tox+ population (left; n = 3; error bars = SD) and immunoreactivity levels (au = arbitrary units) of each of the two makers relative to Tox represented as a linear correlation (middle; n = 79) or box plot (right; n ≥ 24), respectively. ***P < 0.001. Scale bars, 50 μm (A) or 40 μm (B).

