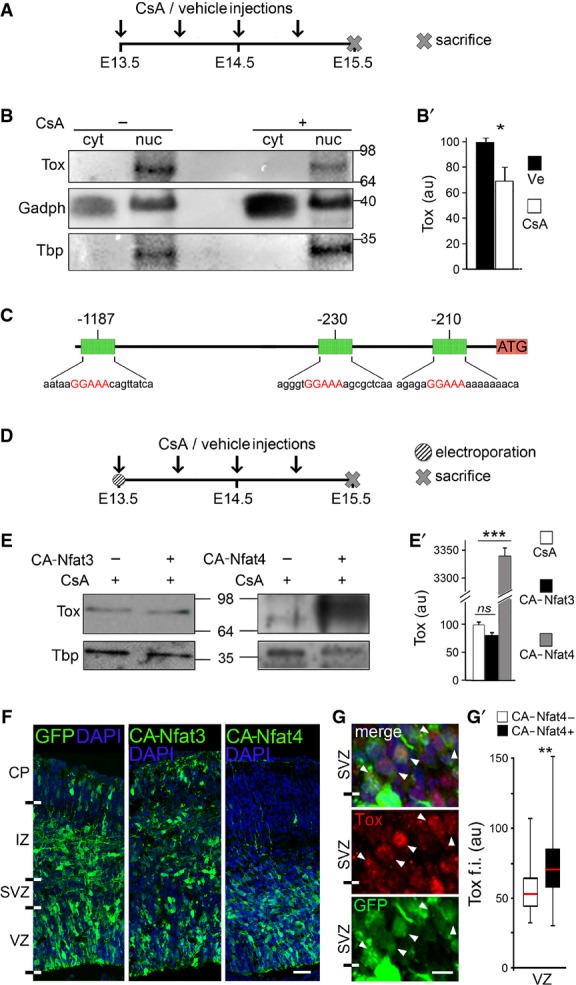
Figure 2.

- A-B′ Layout of CsA, or vehicle as control, administration during embryonic development (A) and Western blot analysis (B) of Tox levels in cytoplasmic (cyt) or nuclear (nuc) fractions of E15.5 brains. Quantifications (B′) were performed upon internal normalization for Gadph or Tbp and referred to treatment with vehicle. n = 3; error bars = SD; *P < 0.05.
- C Map of Tox locus and Nfat-binding recognition sites (red) identified by MatInspector.
- D-E′ Layout of CsA or vehicle administration and Western blot analysis as in (A–B′) upon in utero electroporation with CA-Nfat3 or CA-Nfat4 vectors at E13.5. Tox in extracts of E15.5 brains was quantified normalized to Tbp and referred to CsA treatment. n = 3; error bars = SD; ***P < 0.001.
- F-G′ Fluorescent pictures of the mouse cortex upon electroporation with GFP, CA-Nfat3 or CA-Nfat4 (as indicated) followed by GFP (green) or Tox (G; red) immunolabelling and DAPI counterstaining (blue). Tox upregulation after CA-Nfat4 overexpression was assessed within nuclei of GFP+ cells (n = 30) in the VZ and represented as a box plot relative to GFP− cells (n = 30) used as internal control (G′). Tox ectopic expression within the SVZ is indicated (G; arrowheads). Scale bar, 50 μm (F) and 5 μm (G); **P < 0.01.
