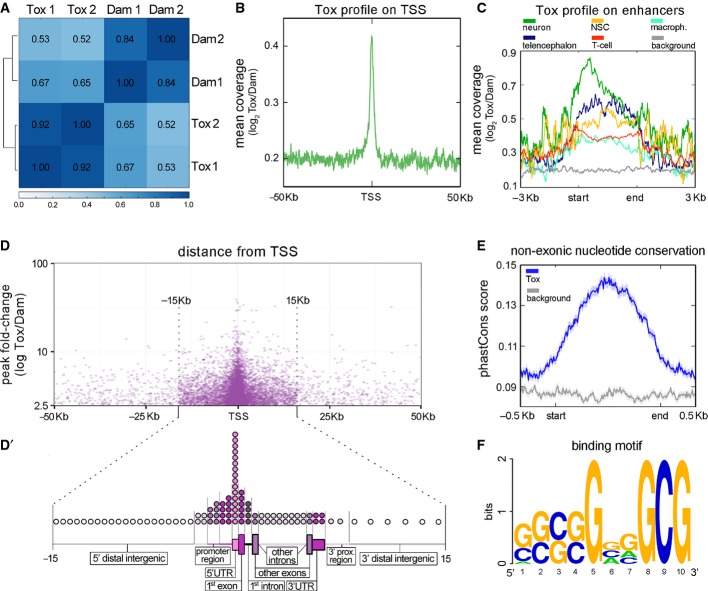
A Pearson's correlation analysis between Tox-Dam versus Dam reads of HEK-293T cells sampling the genome in windows of 10 kb.
B Meta-analysis of normalized Tox-Dam at the transcription start site (TSS) of Ensembl-annotated genes.
C Profile of normalized Tox-Dam reads on cell-specific enhancers (colours; categories ordered according to enrichment). Background (grey) was assessed based on the Tox signal at random genomic locations.
D Relationship between the fold-change of Tox peaks and their distance to the TSS. Note the enrichment in peaks at the boundary of ±15 kb from TSS and the correlation between their fold-change and proximity to the TSS.
D′ Distribution of Tox peaks within regions of loci (as indicated). The relative length of each genomic region was chosen to represent its average length across the human genome and circles distributed to represent the proportion of Tox peaks mapping on that given region (1 circle = 1%).
E PhastCons scores of 100 vertebrate genomes averaged for the Tox peak locations (blue) and for a matched genomic background (grey) showing higher conservation within Tox peaks (start-end).
F Putative 10-mer binding motif of Tox identified with gimmeMotifs.

