
Figure 4.
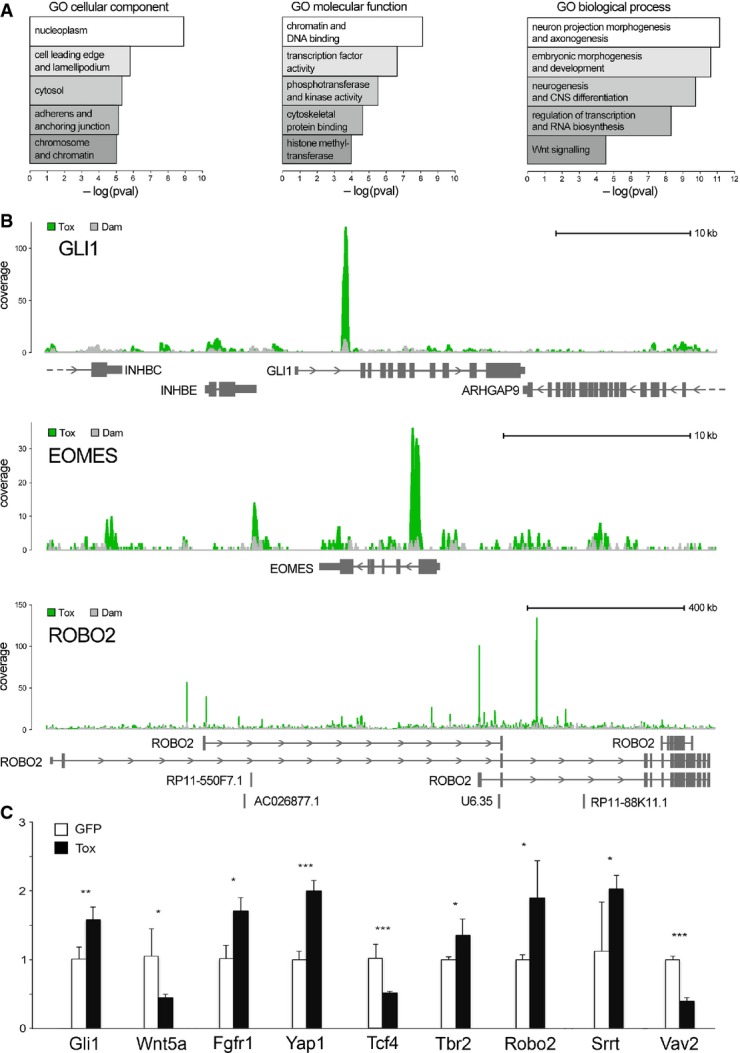
Tox controls neurogenic determinants
- Functional enrichment scores for cellular compartment, molecular function and biological process (left to right).
- Examples of Tox-Dam (green) or Dam (grey) peaks (superimposed in each panel) for Gli1, Eomes/Tbr2 and Robo2 (top to bottom) to represent factors involved in signalling, neurogenic commitment and neurite outgrowth, respectively.
- qRT–PCRs of GFP+ FAC-sorted cells from the E15.5 mouse brain upon electroporation at E13.5 with control (white) or Tox (black) constructs. Primers (Supplementary Table S1) were selected to amplify multi-exon transcripts (indicated) to represent the classes of genes that would explain functional annotations in (A). n ≥ 3; error bars = SD; *P < 0.05; **P < 0.01; ***P < 0.001.