Figure 6.

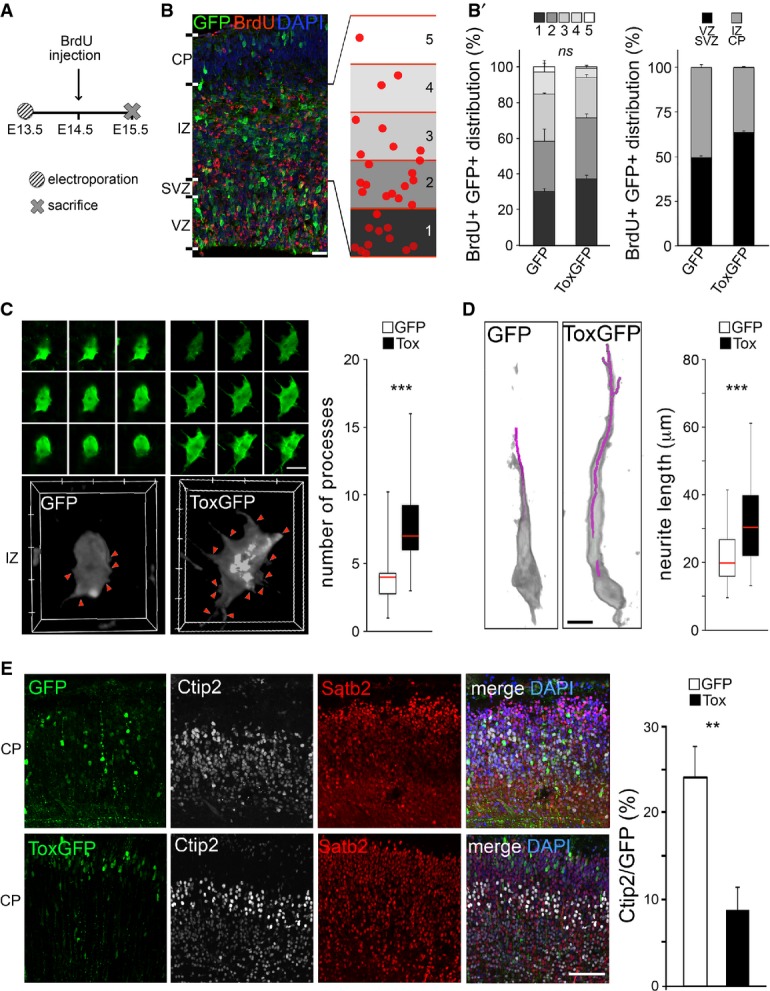
- A-B′ Experimental layout (A), fluorescence pictures (B) and quantifications (B′) used to assess neuronal migration and output upon electroporation with GFP or Tox (B′; as indicated) plasmids at E13.5 followed by BrdU exposure and sacrifice as shown in (A). Neuronal migration was assessed by calculating the distribution of GFP+/BrdU+ cells within five equidistant bins of the IZ (B and B′; left), while output was quantified as the proportion of GFP+/BrdU+ in the IZ and CP relative to all GFP+ cells (B'; right). n = 2; error bars = SEM. Scale bar, 50 μm.
- C, D 3D reconstruction (left) and quantification (right) of newborn (C) or polarized (D) neurons in the IZ or CP, respectively. Individual Z-stacks (0.1 μm optical thickness; green) and computer reconstructions (grey) were used to count cell protrusions (C; arrowheads) or neurite length (D; purple line) that were statistically evaluated (box plots; right, n ≥ 49; ***P < 0.001). Scale bars, 10 μm.
- E Fluorescence pictures (left) of the E18.5 mouse cortex upon electroporation of GFP or Tox plasmids at E13.5 followed by immunohistochemistry for GFP (green), Ctip2 (white), Satb2 (red) and DAPI counterstaining (blue). Quantification of Ctip2+/GFP+ cells is shown in either condition (right). n = 3; **P < 0.01; error bars = SD. Scale bar, 50 μm.
