
Figure 1.
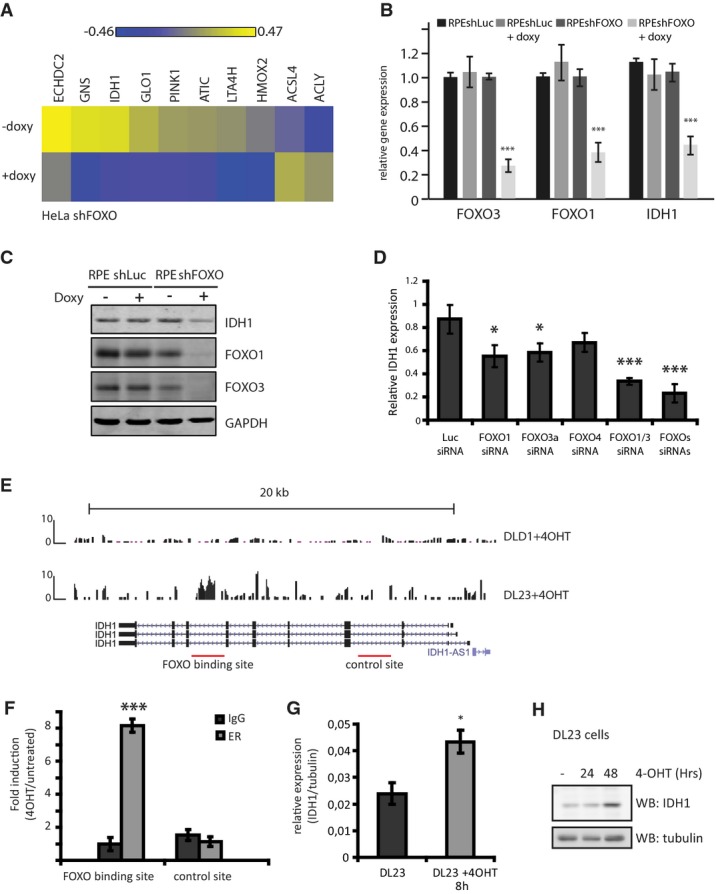
FOXOs regulate the expression of IDH1
- Heat map of selected metabolic genes showing differential expression in FOXO-depleted HeLashFOXO cells. HeLashFOXO cells were grown in the presence or absence of doxycycline for 72 h before RNA was collected and used for gene expression analysis. Results are represented as LIMMAS, comparing each sample against a common reference.
- Relative FOXO3, FOXO1, and IDH1 mRNA levels in RPEshLuc and RPEshFOXO depleted or not of FOXOs. RPEshFOXO cells were cultured in the presence or absence of doxycycline for 72 h before sample collection (n = 3).
- IDH1, FOXO1, and FOXO3 protein levels in RPEshLuc and RPEshFOXO depleted or not of FOXOs. Cells were grown in the presence or absence of doxycycline for 72 h before sample collection. Results are representative of at least three independent experiments.
- Relative mRNA levels of IDH1 in RPE cells transfected with the indicated siRNAs. RNA samples were collected 72 h post-siRNA transfection. IDH1 expression was normalized by tubulin expression (n = 3).
- ChIP-sequencing analysis identified a FOXO3 binding site in the IDH1 genomic region in DL23 cells.
- ChIP–qPCR in DL23 cells 4 h after FOXO3 activation. The IDH1 (+) and the IDH1 (−) introns correspond to the FOXO binding site and the negative site in IDH1 (n = 3).
- Relative IDH1 mRNA levels in DL23 cells. DL23 cells were induced with 4-OHT for 4 h before sample collection (n = 3).
- IDH1 protein levels in DL23 cells grown in the presence of 4-OHT for different time points before sample collection. Result is representative of three independent experiments.