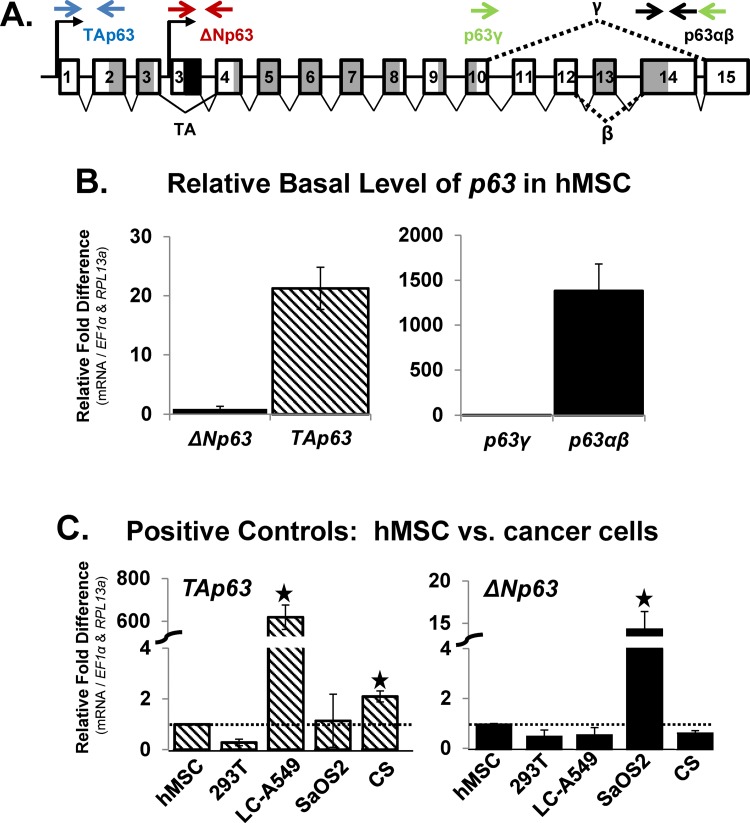
Fig 1. TAp63α and -β are the predominant endogenous p63 gene products in naive hMSC.
A) Schematic diagram (modified from [38]) depicting the p63 gene structure with the exons numbered sequentially and the relative location of primer pairs versus p63 exons used for RT-qPCR analysis of mRNA expression of the p63 mRNA isoforms (TA- and ΔNp63) and splice variants (p63α / β and p63γ). B) hMSC were seeded at low-density (1,000 cells/cm2) and grown under expansion conditions to maintain the pool of naive hMSC. RT-qPCR analysis of mRNA expression of the p63 isoforms (left panel; TA- and ΔNp63) and splice variants (right panel; p63α / β and p63γ) under expansion conditions, expressed as relative fold difference. The real-time calculated PCR primer pair efficiency was calculated for each primer pair set in order to compare the relative fold difference in p63 variant expression in hMSC. C) RT-qPCR analysis of mRNA expression comparing hMSC versus various cancer cell lines was used to validate p63 primer pair sets and compare p63 expression in hMSC versus known expression in cancer cells as a positive control. Cell lines: human embryonic kidney (293T), non-small cell lung cancer (LC-A549), osteosarcoma (SaOS2); chondrosarcoma primary cell culture (CS). N = 3 independent experiments in triplicate. (*) p ≤0.05 compared to (B) left panel: ΔNp63, right panel: TAp63 or (C) hMSC, which were set to the value of “1”. hMSC used were from a 7 and 22 year old male.

