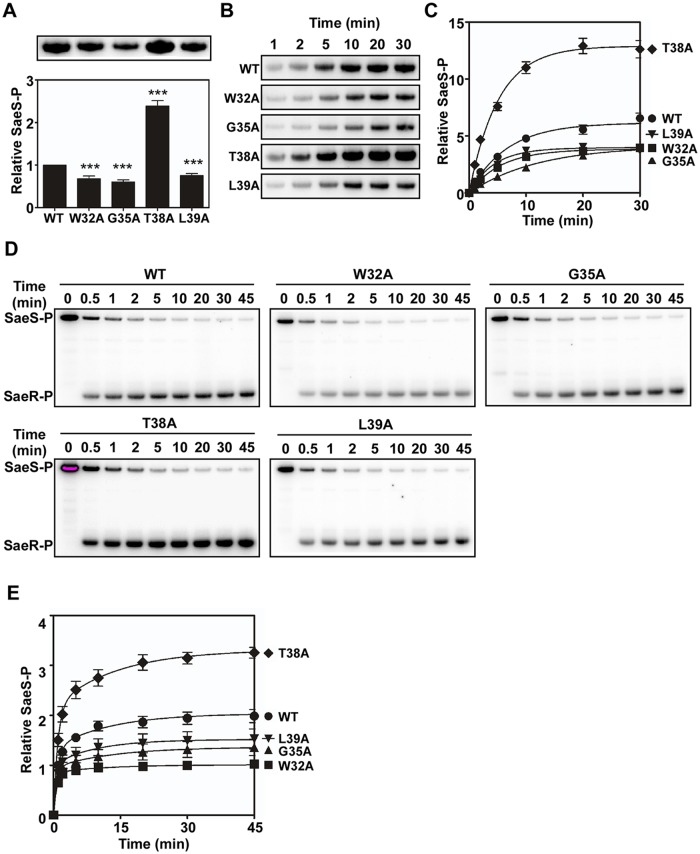
Fig 5. Alanine substitutions in the linker peptide alter the kinase and phosphotransferase activities of SaeS.
(A) The autokinase activity of wild type (WT) and select linker peptide mutants of SaeS. The purified MBP-SaeS proteins (5 μM) were incubated with [γ-32P] ATP at RT for 20 min. The autoradiograph of the phosphorylated MBP-SaeS (upper panel) is shown with its quantification results in a bar graph (lower panel). (B) Assessment of the autokinase activity of wild type (WT) and select linker peptide mutants for 30 min. The wild-type or the linker peptide mutant MBP-SaeS proteins (5 μM) were mixed with [γ-32P] ATP and, at the indicated times, the level of phosphorylated MBP-SaeS was analyzed by phosphor imager analysis. (C) Quantitation of the autophosphorylation assays shown in (B). The plot depicts the levels of MBP-SaeS-P relative to the wild-type MBP-SaeS-P at time 1 min as a function of time. (D) Phosphotransferase activity of the wild type (WT) and select linker peptide mutants of SaeS. Phosphorylated MBP-SaeS (5 μM) was mixed with SaeR (10 μM). At the times indicated, the reaction was stopped and the phosphorylated proteins were analyzed by SDS-PAGE and phosphor imager analysis. (E) Quantification of the phosphotransfer assays shown in (D). Each datum on the plot depicts the level of SaeR-P relative to that of the wild-type SaeS at the initial time (1 min). All data correspond to the mean values of three independent experiments, and error bars show standard deviation. For statistical analyses, unpaired two-tailed student’s t-test was used. ***, p < 0.001

