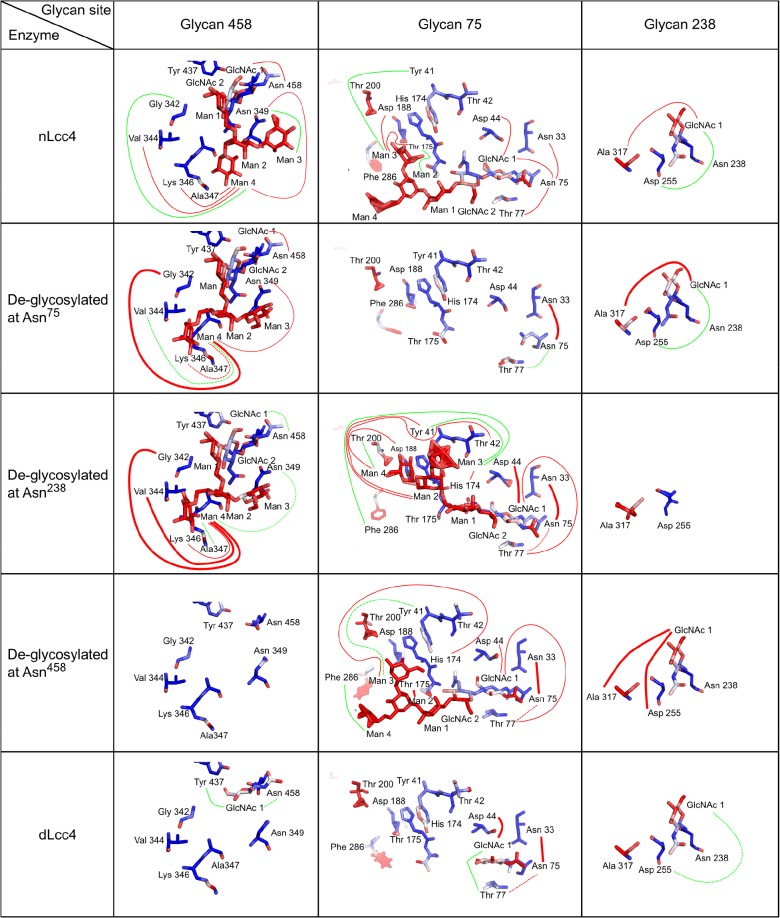
Fig 8. Hydrogen bond network of the three glycans under different glycosylation conditions.
Hydrogen bonds are depicted as lines stretching from one partner to the other. Red lines represent strong bonds (occupancy >10% of the total simulation time) and green lines represent weak bonds (occupancy <10% of the total simulation time). Further, de-glycosylation simulation results are compared to the native state by the representation of weaker hydrogen bonds as dotted lines, and stronger hydrogen bonds with thicker lines. All data evaluation was performed with ptraj.

