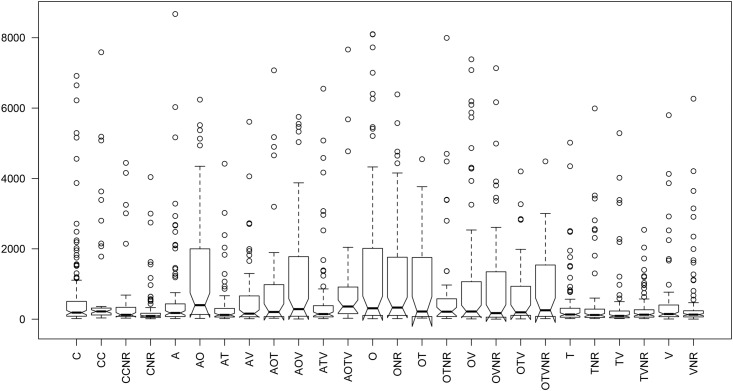
Fig 2. Notched boxplot of copulation latencies represented by the median (black lines), indicating 95% confidence interval of medians (the notches), interquartile ranges (upper and lower limits of the notches), and the minimum and maximum values (lower and upper whiskers).
For the details of treatments see Table 1.

