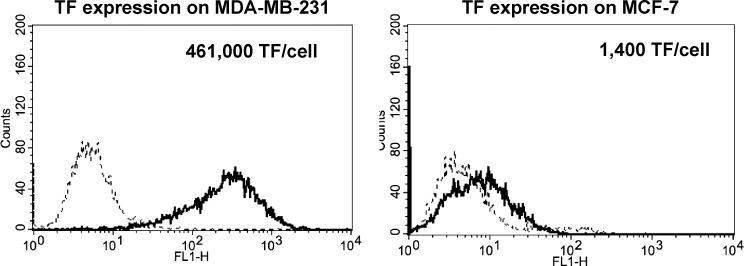
Fig 2. TF surface expression and density on breast cancer cells.
Representative fluorescence histograms of TF expression on MDA-MB-231 and MCF-7 cells. Cells (5x10⁵) were incubated with a monoclonal antibody against TF (TF9-5B7, 80μg/mL), followed by an Alexa-488-conjugated secondary antibody (10μg/mL). Fluorescence was detected (bold line) using flow cytometry with isotype IgG as a control (dotted line). Tissue factor was strongly expressed on MDA-MB-231, but little expression was found on MCF-7 (n = 3). The surface ligand density is also shown for each cell line.

